
Limits 2
Loading the math board and drawing, please wait…
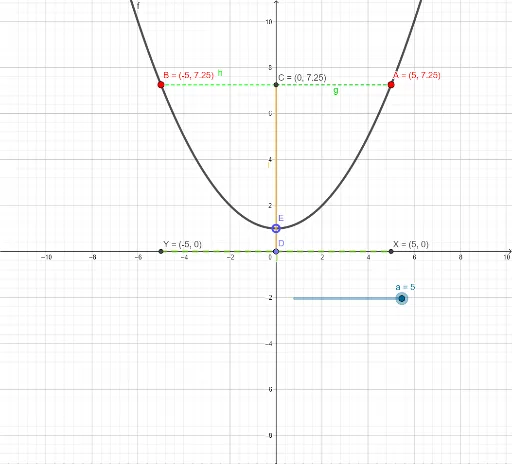
This example illustrates the concept of limits, showing the limit value of a function at a specific point through geometric figures. Key mathematical concepts include functions, limits, and derivatives. It uses GeoGebra commands such as Distance, Segment, and Point, suitable for high school mathematics education and learning.
GeoGebra Commands & Parameters
Distance(A, C) → ACSegment(C, A) → gSegment(C, B) → hPoint(yAxis) → DSegment(C, D) → iSegment(Y, X) → j
AI Drawing Prompt Reference
Draw a function graph and illustrate its limit at point C. Start by plotting points C, A, and B, then calculate the distance AC. Draw line segments CA and CB. Take a point D on the y-axis, connect C and D, and finally draw the intersection of the x-axis and y-axis.
The prompt above was compiled from the original drawing commands and is for reference only.