
Letter Distribution
Loading the math board and drawing, please wait…
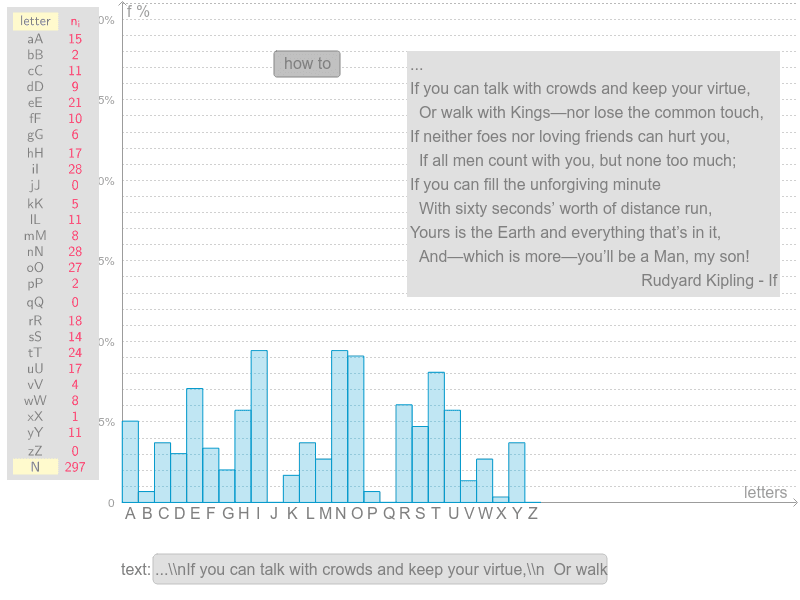
This example demonstrates the distribution of letters in an English text and visualizes it with a histogram. Key math concepts include probability and statistics. It uses commands like TextToUnicode, CountIf, Sum, TiedRank, Textfield, Sequence, and Histogram in GeoGebra. Suitable for middle school students learning probability and statistics.
GeoGebra Commands & Parameters
TextToUnicode(Tekst) → kodoviTextToUnicode(A1) → B1TextToUnicode(A2) → B2TextToUnicode(A3) → B3TextToUnicode(A4) → B4TextToUnicode(A5) → B5TextToUnicode(A6) → B6TextToUnicode(A8) → B8TextToUnicode(A9) → B9TextToUnicode(A10) → B10TextToUnicode(A11) → B11TextToUnicode(A16) → B16TextToUnicode(A22) → B22TextToUnicode(A7) → B7TextToUnicode(A12) → B12TextToUnicode(A13) → B13TextToUnicode(A14) → B14TextToUnicode(A15) → B15TextToUnicode(A17) → B17TextToUnicode(A18) → B18TextToUnicode(A19) → B19TextToUnicode(A20) → B20TextToUnicode(A21) → B21TextToUnicode(A23) → B23TextToUnicode(A24) → B24TextToUnicode(A25) → B25TextToUnicode(A26) → B26TextToUnicode(A27) → B27CountIf(x ≟ Element[B1, 1] ∨ x ≟ Element[B1, 2], kodovi) → C1CountIf(x ≟ Element[B2, 1] ∨ x ≟ Element[B2, 2], kodovi) → C2CountIf(x ≟ Element[B3, 1] ∨ x ≟ Element[B3, 2], kodovi) → C3CountIf(x ≟ Element[B4, 1] ∨ x ≟ Element[B4, 2], kodovi) → C4CountIf(x ≟ Element[B5, 1] ∨ x ≟ Element[B5, 2], kodovi) → C5CountIf(x ≟ Element[B6, 1] ∨ x ≟ Element[B6, 2], kodovi) → C6CountIf(x ≟ Element[B7, 1] ∨ x ≟ Element[B7, 2], kodovi) → C7CountIf(x ≟ Element[B8, 1] ∨ x ≟ Element[B8, 2], kodovi) → C8CountIf(x ≟ Element[B9, 1] ∨ x ≟ Element[B9, 2], kodovi) → C9CountIf(x ≟ Element[B10, 1] ∨ x ≟ Element[B10, 2], kodovi) → C10CountIf(x ≟ Element[B11, 1] ∨ x ≟ Element[B11, 2], kodovi) → C11CountIf(x ≟ Element[B12, 1] ∨ x ≟ Element[B12, 2], kodovi) → C12CountIf(x ≟ Element[B13, 1] ∨ x ≟ Element[B13, 2], kodovi) → C13CountIf(x ≟ Element[B14, 1] ∨ x ≟ Element[B14, 2], kodovi) → C14CountIf(x ≟ Element[B15, 1] ∨ x ≟ Element[B15, 2], kodovi) → C15CountIf(x ≟ Element[B16, 1] ∨ x ≟ Element[B16, 2], kodovi) → C16CountIf(x ≟ Element[B17, 1] ∨ x ≟ Element[B17, 2], kodovi) → C17CountIf(x ≟ Element[B18, 1] ∨ x ≟ Element[B18, 2], kodovi) → C18CountIf(x ≟ Element[B19, 1] ∨ x ≟ Element[B19, 2], kodovi) → C19CountIf(x ≟ Element[B20, 1] ∨ x ≟ Element[B20, 2], kodovi) → C20CountIf(x ≟ Element[B21, 1] ∨ x ≟ Element[B21, 2], kodovi) → C21CountIf(x ≟ Element[B22, 1] ∨ x ≟ Element[B22, 2], kodovi) → C22CountIf(x ≟ Element[B23, 1] ∨ x ≟ Element[B23, 2], kodovi) → C23CountIf(x ≟ Element[B24, 1] ∨ x ≟ Element[B24, 2], kodovi) → C24CountIf(x ≟ Element[B25, 1] ∨ x ≟ Element[B25, 2], kodovi) → C25CountIf(x ≟ Element[B26, 1] ∨ x ≟ Element[B26, 2], kodovi) → C26CountIf(x ≟ Element[B27, 1] ∨ x ≟ Element[B27, 2], kodovi) → C27Sum(C1:C27) → H28TiedRank(qw) → qw2Sum(G2:G27) → G29Textfield(Tekst) → txtPolje1Sequence(n, n, 0, 26) → intervaliHistogram(intervali, D1:D26) → HistogramTableText({{F1, G1}, {F2, G2}, {F3, G3}, {F4, G4}, {F5, G5}, {F6, G6}, {F7, G7}, {F8, G8}, {F9, G9}, {F10, G10}, {F11, G11}, {F12, G12}, {F13, G13}, {F14, G14}, {F15, G15}, {F16, G16}, {F17, G17}, {F18, G18}, {F19, G19}, {F20, G20}, {F21, G21}, {F22, G22}, {F23, G23}, {F24, G24}, {F25, G25}, {F26, G26}, {F27, G27}, {F29, G29}}, "c") → tekst1
AI Drawing Prompt Reference
Create a histogram showing the frequency of each letter in an English text. First, convert the text to Unicode codes, then count the occurrences of each letter, and finally draw the histogram to display the frequency of each letter.
The prompt above was compiled from the original drawing commands and is for reference only.