
Least Squares Approximation
Loading the math board and drawing, please wait…
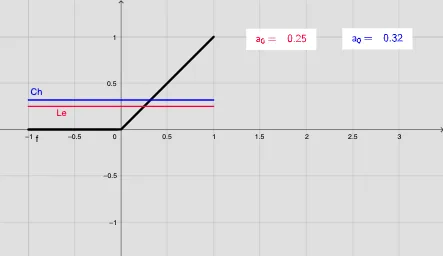
This example demonstrates linear regression via least squares method to fit a line through scattered data points. Core math concepts include least squares, statistical characteristics, normal distribution, similarity transformation, and 2D vectors. Construction highlights involve using GeoGebra commands/objects like Sequence, Sum, Textfield, TableText, and buttons to control function coefficient calculations (Legendre, Chebyshev). Suitable for high school and above learners exploring data fitting and optimization techniques.
GeoGebra Commands & Parameters
Sequence(Integral[(Element[Legendre, i] * f0(x)), -1, 1] / Integral[Element[Legendre, i]^(2), -1, 1], i, 1, 11) → LeCoeffSequence(Integral[((w(x) * Element[Chebyshev, i]) * f0(x)), -0.999999999, 0.999999999] / Integral[(w(x) * Element[Chebyshev, i]^(2)), -0.999999999, 0.999999999], i, 1, 11) → ChCoeffSum(L, n + 1) → LLSum(C, n + 1) → CCTextfield(f0) → InputBox1Sequence(Element[LeCoeff, i], i, 1, n + 1) → list1Sequence(Element[ChCoeff, i], i, 1, n + 1) → list2Sequence(Element[list3, i], i, 1, n + 1) → list4TableText({list4, list1}, "v") → text1TableText({list4, list2}, "v") → text2