
Kruskal's Algorithm
Loading the math board and drawing, please wait…
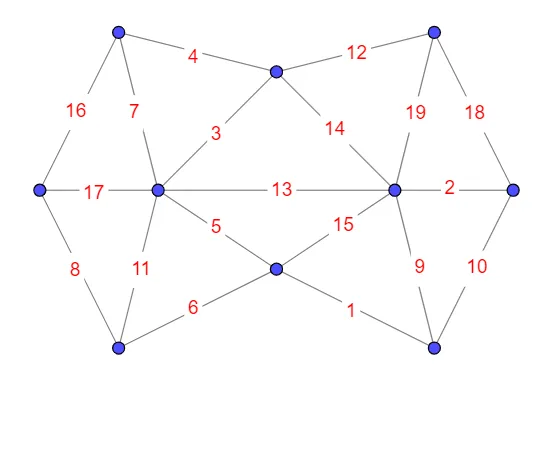
This example demonstrates how Kruskal's algorithm constructs a minimum spanning tree. Key mathematical concepts include minimum spanning trees in graph theory. Using GeoGebra commands such as Length, Segment, Shuffle, etc., users can visually understand the algorithm's steps. Suitable for high school and above students learning graph theory and algorithms.
GeoGebra Commands & Parameters
Length(Unique[Flatten[vertsofedge]]) → numberOfNodesLength(vertsofedge) → numberOfEdgesSegment(A, B) → e1Segment(B, C) → e2Segment(D, A) → e3Shuffle(WtsOrdered) → Wts, {4, 12, 16, 7, 3, 14, 19, 18, 17, 13, 2, 8, 11, 5, 15, 9, 10, 6, 1}KeepIf(componentOfNode(vertsofedge(j, 1)) ≠ componentOfNode(vertsofedge(j, 2)), j, 1…numberOfEdges) → CandidateEdgesMin(Zip[Wts(j), j, CandidateEdges]) → nextminweightSegment(A, F) → e4Segment(B, F) → e5Segment(B, G) → e6Segment(C, G) → e7Segment(C, H) → e8Segment(D, F) → e9Segment(F, G) → e10Segment(G, H) → e11Segment(D, I) → e12Segment(I, F) → e13Segment(F, J) → e14Segment(J, G) → e15Segment(G, K) → e16Segment(K, H) → e17Segment(I, J) → e18Segment(J, K) → e19If(E ≟ {}, {}, Unique[Flatten[Zip[vertsofedge(j), j, E]]]) → V
AI Drawing Prompt Reference
Visualize Kruskal's algorithm constructing a minimum spanning tree with multiple nodes and edges, using different colors or thicknesses to represent edge weights, progressively adding edges until forming an acyclic graph covering all nodes, highlighting the features of the minimum spanning tree for students learning graph theory and algorithms.
The prompt above was compiled from the original drawing commands and is for reference only.