
Jessica Bennett's Scatter Plot
Loading the math board and drawing, please wait…
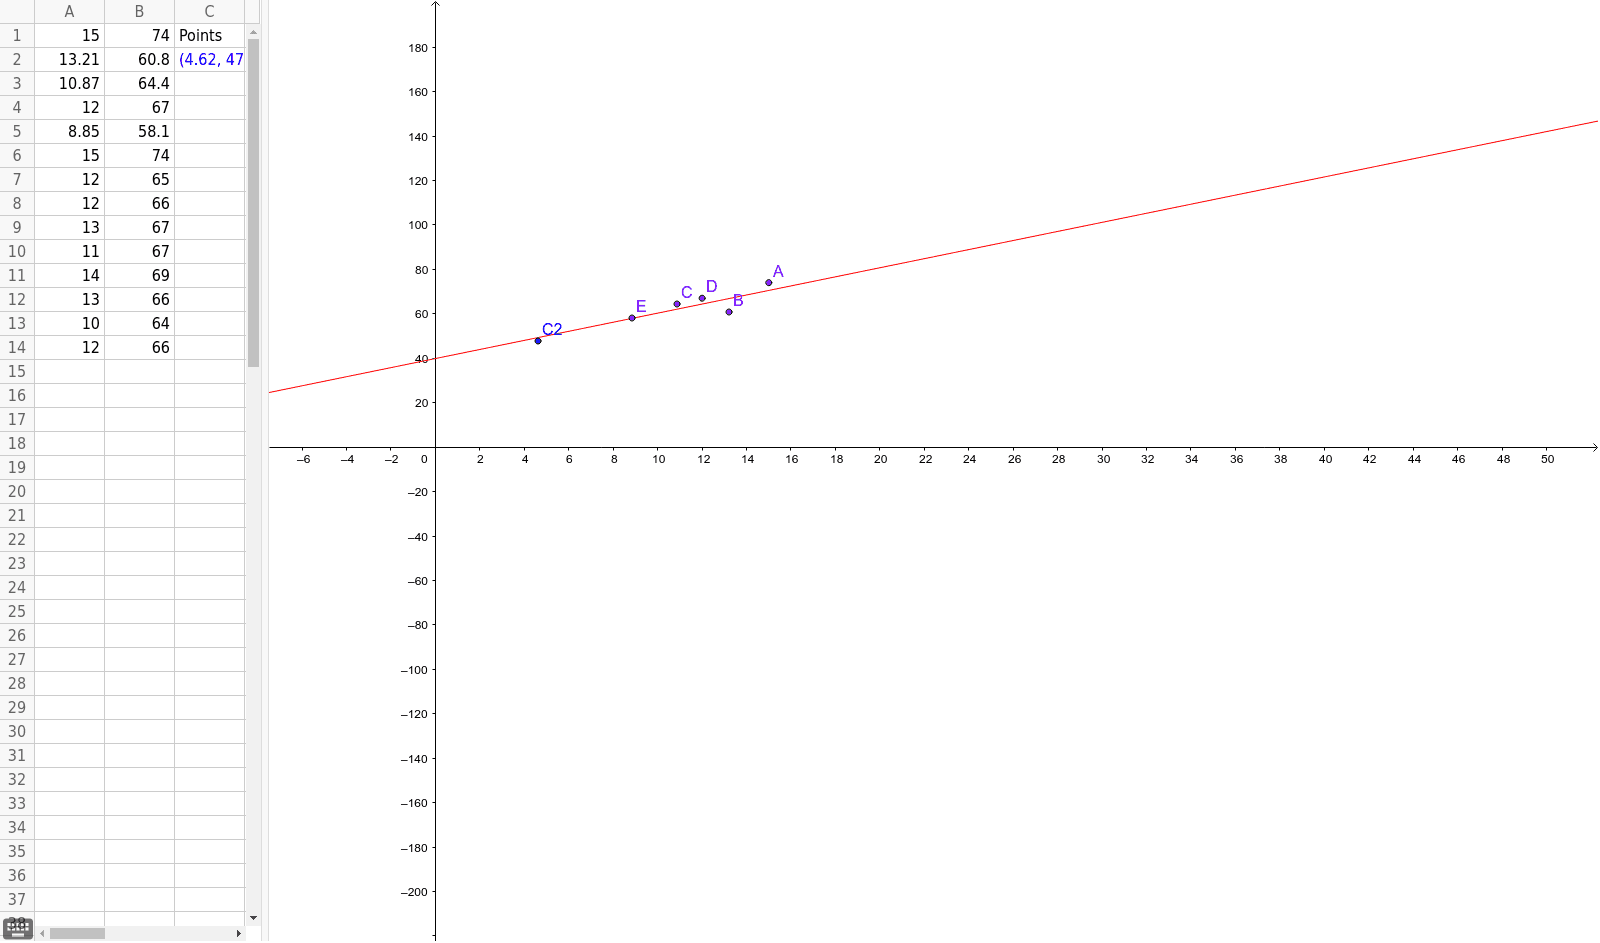
This example demonstrates how to use a scatter plot to visualize relationships involving natural numbers, the Pythagorean theorem, parabolas, combinatorics, and variance. Key math concepts include scatter plots, natural numbers, the Pythagorean theorem, parabolas, combinatorics, and variance. The construction uses the GeoGebra command FitLineY to fit a line through points A1-A14 and B1-B14, creating a scatter plot with a trend line. Suitable for high school and above, this example illustrates the integration of data visualization with core mathematical ideas.
GeoGebra Commands & Parameters
FitLineY({A, B, C, E}) → a
AI Drawing Prompt Reference
Create a scatter plot with 14 points A1 to A14 and 14 points B1 to B14, and fit a trend line through these points. The plot should include natural numbers, Pythagorean theorem, parabolas, combinatorics, and variance. First, plot points A1 to A14 and B1 to B14, then fit a trend line through these points, and finally display the scatter plot with the trend line.
The prompt above was compiled from the original drawing commands and is for reference only.