
It's the Great Pumpkin, Charlie Brown Graphing Activity: Scatter Plot & Linear E
Loading the math board and drawing, please wait…
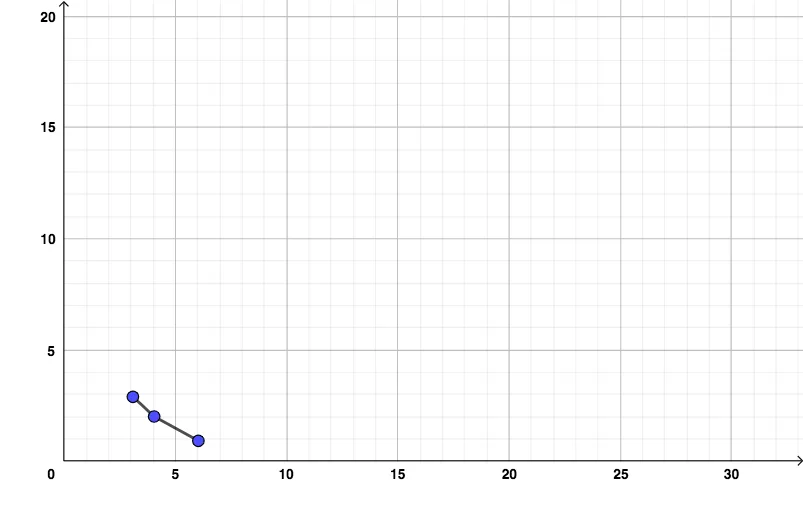
① This activity demonstrates how to create the iconic 'Great Pumpkin' character using scatter plots and line segments in GeoGebra, blending art with mathematics. ② Core math concepts include scatter plots, linear equations, segments, and introductory conic sections, with a thematic tie to interest calculation as a real-world context. ③ Construction: Based on the summary, the Segment command is used to define objects A, B, f, C, and g—points A, B, C and lines/functions f, g—connecting key coordinates to outline the pumpkin shape, possibly with sliders for dynamic adjustment. ④ Suitable for middle and high school students, this activity serves as a fun Halloween-themed graphing project, reinforcing coordinate geometry, linear relationships, and graph construction skills.
GeoGebra Commands & Parameters
Segment(A, B) → fSegment(B, C) → g
AI Drawing Prompt Reference
Draw a pumpkin by connecting points A and B with a line segment, then connect B and C. Use sliders to adjust the segments for a more dynamic pumpkin shape.
The prompt above was compiled from the original drawing commands and is for reference only.