
Investigating the Derivative of Sine: Tangent Slope and Function Graph
Loading the math board and drawing, please wait…
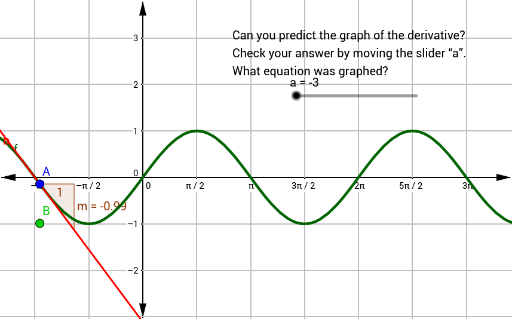
①This example dynamically shows the tangent line and its slope at a moving point on the sine function graph, visually demonstrating the geometric meaning of the derivative of sine—the rate of change of the tangent slope. ②Core mathematical concepts include derivatives, trigonometric functions, the fundamental fact that the derivative of sine is cosine, as well as tangent lines, slopes, and function graphs. ③Construction highlights: using GeoGebra commands Tangent to construct the tangent line to the sine function f at a movable point A, and Slope to compute the slope m of that tangent; a point B and text1 display the slope value, allowing users to drag A and observe how the slope changes with position. ④Suitable for high school or early college students learning calculus, to understand the definition of the derivative, the connection between tangent slope and rate of change, and as a classroom demonstration or self-guided exploration tool.
GeoGebra Commands & Parameters
Tangent(A, f) → bSlope(b) → m
AI Drawing Prompt Reference
Draw a sine curve. Place a movable point on the curve. At this point, construct the tangent line to the sine curve. Display the slope of this tangent line as a numeric value. As the point moves along the curve, the tangent line and its slope change accordingly, illustrating that the derivative of sine is cosine. Include the sine curve, the moving point, the tangent line, the slope value, and optionally a trace of slope values.
The prompt above was compiled from the original drawing commands and is for reference only.