
Inverses of Functions
Loading the math board and drawing, please wait…
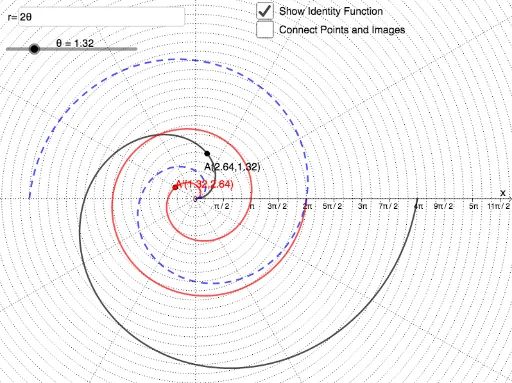
This example demonstrates the graphical relationship between a function and its inverse. Key mathematical concepts include functions, inverse functions, and Cartesian curves. Using GeoGebra commands such as Ray, Angle, and CurveCartesian, the construction process of the function and its inverse is visually illustrated. Suitable for high school mathematics education and learning.
GeoGebra Commands & Parameters
Ray(O, A) → fAngle(A', O, D) → γAngle(D, O, A) → δCurveCartesian((e(θ); θ), θ, 0, (2 * 3.141592653589793)) → gTextfield(e) → InputBox1CurveCartesian(((-θ) + α + e(α); θ), θ, Min[e(α), α], Max[e(α), α]) → dCurveCartesian((θ; e(θ)), θ, 0, (2 * 3.141592653589793)) → hCurveCartesian((θ; θ), θ, 0, π + e((2 * π)) / 2) → a
AI Drawing Prompt Reference
Draw a graph showing the relationship between a function and its inverse. Start with a ray from the origin as a reference line. Then mark two angles that illustrate the angular relationship between a point on the function and its corresponding point on the inverse. Next, draw a unit circle centered at the origin, and place an input box on it to adjust a parameter. After that, plot two curves: one for the original function and one for its inverse, which are symmetric about the line y=x. Finally, draw a line segment from the origin along the line y=x as the axis of symmetry. This visually demonstrates the geometric correspondence between a function and its inverse in the coordinate plane.
The prompt above was compiled from the original drawing commands and is for reference only.