
Introduction to Slope: Exploring Line Slope with a Slider
Loading the math board and drawing, please wait…
In collections
Coordinates and Linear Equations
Coordinates and Linear Equations
Coordinates and Linear Equations
Coordinates and Linear Equations
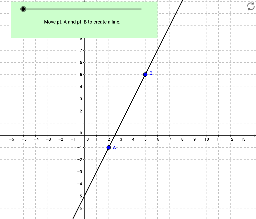
①This example demonstrates how to interactively explore the slope of a line using a slider and visualize its geometric meaning. ②Key mathematical concepts covered include the definition of slope, vector representation, slope calculation in coordinate geometry, and connections to trigonometric functions. ③The GeoGebra construction employs points A and B, creates line AB, uses vectors to compute rise and run, adjusts points via a slider, dynamically displays the slope value, and presents results with text objects; Midpoint, Polygon, and other commands are also utilized for geometric clarity. ④Designed for high‑school students and teachers, it is suitable for algebra and geometry lessons, classroom demonstrations, and student inquiry activities.
GeoGebra Commands & Parameters
Line(A, B) → aVector(A, C) → uVector(C, B) → vMidpoint(A, C) → DMidpoint(C, B) → EGCD(rawrise, rawrun) → reducebyPoint(a) → FVector(F, G) → wVector(G, H) → zMidpoint(G, F) → IMidpoint(G, H) → JPolygon(K, L, M, N) → poly1, k, l, m, n