
Introduction to Sine and Cosine Curves with Unit Circle
Loading the math board and drawing, please wait…
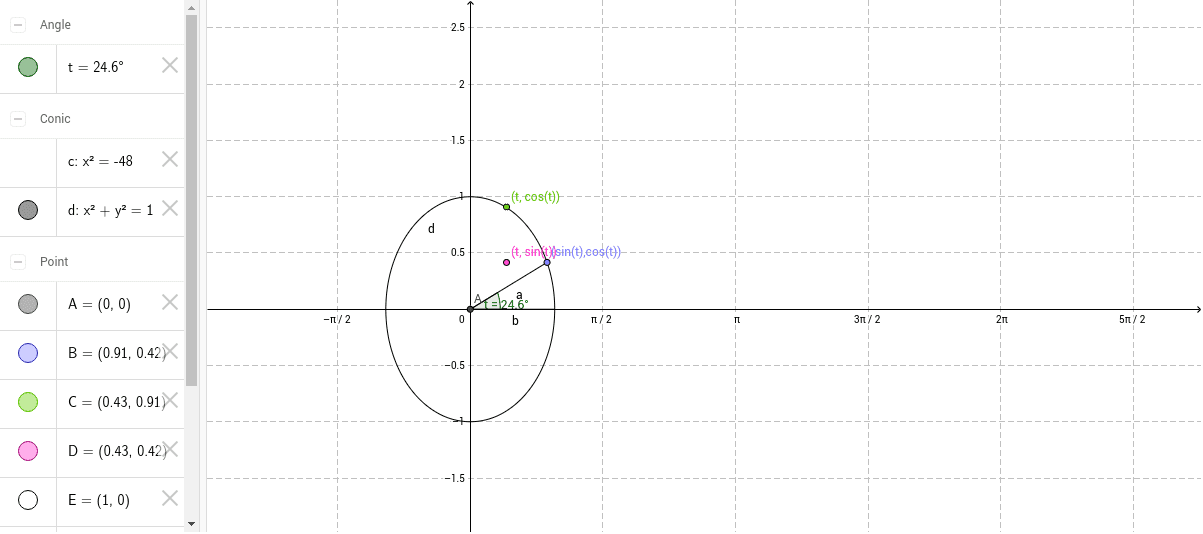
This example demonstrates the formation of sine and cosine curves using the unit circle. It shows how the projections of points on the unit circle onto the coordinate axes are used to plot the sine and cosine function graphs. Key math concepts include the unit circle, trigonometric functions, coordinate geometry, and function graphing. GeoGebra commands and objects used in the construction are Intersect, Circle, Point, Segment, and Angle. Suitable for high school students learning about the origin and properties of trigonometric function graphs.
GeoGebra Commands & Parameters
Intersect(xAxis, yAxis) → ACircle(A, 1) → dPoint(d) → BSegment(A, B) → aIntersect(d, xAxis, 2) → ESegment(A, E) → bAngle(E, A, B) → t
AI Drawing Prompt Reference
Draw a unit circle and mark a point on it. Project this point onto the x-axis and y-axis to get two intersection points. Connect the origin to the point on the circle and the projection point on the x-axis to form two line segments. Then connect the point on the circle to its projection on the x-axis to form a third line segment. Finally, draw the unit circle, the three line segments, and the x-axis and y-axis to show the formation of sine and cosine function graphs.
The prompt above was compiled from the original drawing commands and is for reference only.