
Introduction to Double Number Line Diagrams Practice
Loading the math board and drawing, please wait…
In collections
Unit 2 Homework: Intro to Ratios
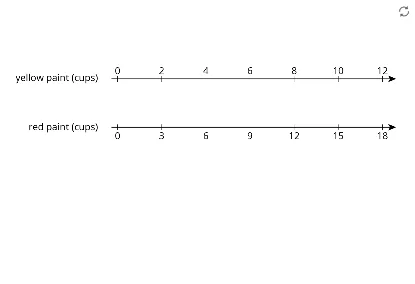
This example demonstrates how to use Double Number Line Diagrams to visualize proportional relationships between two related quantities. Double Number Line Diagram is an important algebraic tool that displays linear relationships between two variables by marking corresponding points on two parallel number lines. Key mathematical concepts include: ratio and proportion, linear equations, and dimensional analysis. Construction details: Use GeoGebra point tools (A, B) to determine the positions of number lines, with image object (Bild1) possibly serving as a reference illustration for completing the two parallel number lines with labels. This example is suitable for middle school mathematics teaching on ratios and equations, as well as for pre-service teacher training, helping students understand the graphical representation of proportional relationships.
GeoGebra Commands & Parameters
Point A(-13, 4)Point B(3, 4)
AI Drawing Prompt Reference
Draw a double number line diagram to visualize the proportional relationship between two related quantities. Place points A(-13, 4) and B(3, 4) on the coordinate plane, then draw two parallel number lines based on these points and label them to show the linear relationship between the two variables.
The prompt above was compiled from the original drawing commands and is for reference only.