
Representing Ratios with Tables
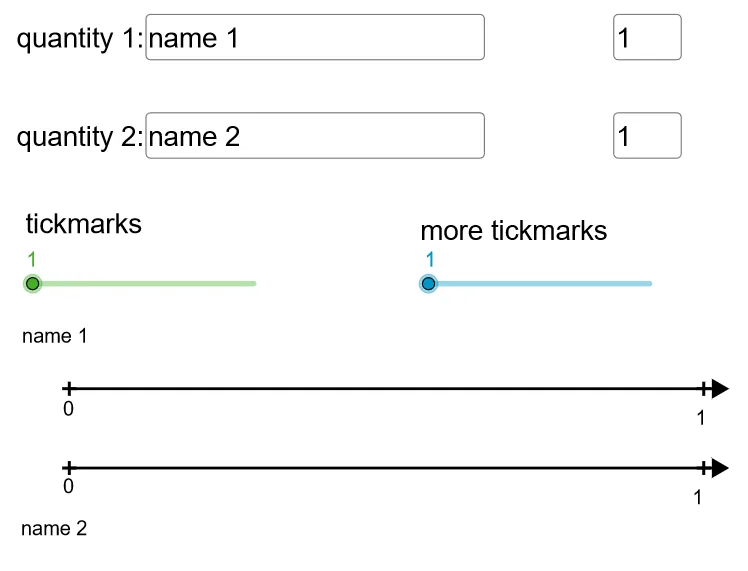
Loading the math board and drawing, please wait…
In collections
Unit 2 Classwork: Intro to Ratios
This example demonstrates how to visually represent ratios using tables. The core math concepts involved include the definition of ratios, the application of tables, and mathematical expression. Construction highlights involve GeoGebra commands/objects like Textfield, Point, Segment, Text, GCD, Sequence as derived from the summary; suitable for middle school mathematics teaching, helping students understand the connection between ratios and tables, and enhancing mathematical modeling skills.
GeoGebra Commands & Parameters
Textfield(text4) → InputBox2Textfield(Q1Jump) → InputBox4Textfield(text5) → InputBox3Textfield(Q2Jump) → InputBox5Point(a) → DSegment(A, D) → cSegment(B, C) → dText("20%", (scale - 0.25, y(A) + yOffSet)) → text6Text(8, (scale - 0.12, y(B) + yOffSet)) → text7GCD(Q1Jump, Q2Jump) → gSegment(A, I) → iSegment(B, J) → kText(0, (x(A) - 0.12, y(A) - (1.2 * yOffSet))) → text2Sequence(((e * v), h), v, 0, f) → Q1marksSequence(((e * k), 0), k, 0, f) → Q2marksSequence(Text[(q * Q1Jump), ((e * q) + topxOffSet, y(B) + yOffSet)], q, 1, f) → TextQ1Sequence(Text[(p * Q2Jump), ((e * p) + xOffSet, y(A) + yOffSet)], p, 1, f) → TextQ2Sequence(Text[(q * Q1Jump / 2), ((e / 2 * q) + topxOffSet, y(B) + yOffSet)], q, 1, (f * 2)) → TextQ1split2Sequence(((e / 2 * l), h), l, 0, (f * 2)) → Q1split2Sequence(((e / 2 * k), 0), k, 0, (f * 2)) → Q2split2Sequence(Text[(p * Q2Jump / 2), ((e / 2 * p) + (1.1 * xOffSet), y(A) + yOffSet)], p, 1, (f * 2)) → TextQ2split2Text(0, (x(B) - 0.12, y(B) + (3.2 * yOffSet))) → text3Sequence(((e / s * l), h), l, 0, (f * s)) → Q1splitSequence(((e / s * k), 0), k, 0, (f * s)) → Q2splitSequence(Text[(q * Q1Jump / s), ((e / s * q) + topxOffSet, y(B) + yOffSet)], q, 1, (f * s)) → TextQ1splitSequence(Text[(p * Q2Jump / s), ((e / s * p) + xOffSet, y(A) + yOffSet)], p, 1, (f * s)) → TextQ2split
AI Drawing Prompt Reference
Draw a ratio table with two segments AB and BC, where A is at the bottom left and B is at the bottom right, representing 20% and 8 respectively. On segment AB, draw lines at intervals of Q1Jump starting from 0, and on segment BC, draw lines at intervals of Q2Jump starting from 0. Label each line with its corresponding value to clearly show the ratio relationship.
The prompt above was compiled from the original drawing commands and is for reference only.