
Introducing Polynomials: A GeoGebra Lesson
Loading the math board and drawing, please wait…
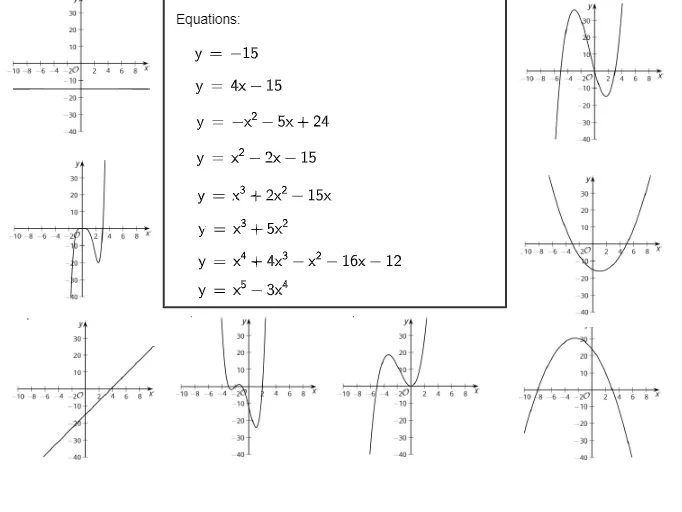
This GeoGebra example demonstrates the graphical representation of polynomial functions through interactive polygon construction. The core mathematical concepts include polynomial functions, function graphing, and geometric construction techniques. The construction utilizes the Polygon command along with various objects such as images pic1 to pic8 and points a, b, c, d, e, f, g, h, q1, i, which likely serve as parameters or key points for defining the polynomials. It is suitable for high school algebra or mathematics courses, providing an engaging way to visualize and understand polynomial behavior.
GeoGebra Commands & Parameters
Polygon((-3.2823039439622352, -1.079974112989191), (3.044664230242118, -1.079974112989191), (3.044664230242118, 4.86404598751332), (-3.2823039439622352, 4.86404598751332)) → q1
AI Drawing Prompt Reference
Draw a quadrilateral with vertices at (-3.28, -1.08), (3.04, -1.08), (3.04, 4.86), and (-3.28, 4.86), and use these points to represent the graph of a polynomial function.
The prompt above was compiled from the original drawing commands and is for reference only.