
Intro to 3D Equations: Exploring 3D Graphs and Vector Spaces
Loading the math board and drawing, please wait…
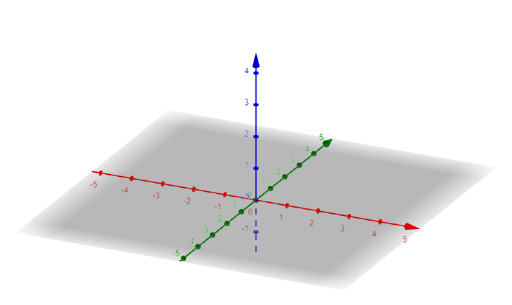
①This example serves as an introductory demonstration of how equations in three-dimensional space generate various 3D graphs, including surfaces, curves, and geometric objects defined by vectors. ②Core mathematical concepts include 3D coordinate systems, vector operations, parametric equations, differential equations, symmetry, and solid geometry shapes (e.g., spheres, cylinders) as well as special points like the orthocenter. ③Construction highlights: although no specific GeoGebra commands are listed in the summary, based on the topic tags, the example likely utilizes the 3D graphics view with surface tools, vector inputs (e.g., `Vector`), parametric curves (e.g., `Curve`), and sliders (`Slider`) to dynamically adjust equation parameters and observe resulting shape changes. ④This resource is suitable for high school to early university students, serving as a visual teaching aid for abstract 3D equations and geometric relationships, and can be used for teacher demonstrations or student self-exploration.
AI Drawing Prompt Reference
Visualize various 3D graphs including surfaces, curves, and geometric objects defined by vectors, demonstrating 3D coordinate systems, vector operations, parametric equations, symmetry, and solid geometry shapes like spheres and cylinders, with special points such as the orthocenter, using sliders to dynamically adjust parameters and observe shape changes.
The prompt above was compiled from the original drawing commands and is for reference only.