
Intersection of Sphere and Cone by Walter Füchte
Loading the math board and drawing, please wait…
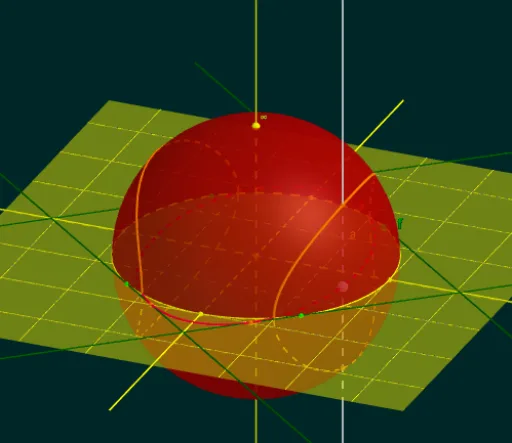
This example demonstrates the geometric figure formed by the intersection of a sphere and a cone. Key mathematical concepts include spheres, cones, and plane figures. Using GeoGebra commands such as Point, Intersect, Circle, Tangent, Line, Sphere, and Plane, these geometric figures can be constructed. Suitable for high school or university geometry courses.
GeoGebra Commands & Parameters
Point(xAxis) → BIntersect(xAxis, yAxis) → ACircle(A, B) → cTangent(F, c) → j,Point(c) → ELine(E, B) → gIntersect(g, j) → MPoint(c) → DPoint(c) → CLine(C, D) → f_1Intersect(f_1, j) → GPoint(zAxis) → F_1Sphere(A, F_1) → bPlane(A, F_1, B) → dIntersectPath(d, b) → ePlane(A, F_1, D) → hIntersectPath(h, b) → kLine(A, F_1) → iMirror(F, f_1) → G'Mirror(F, g) → G'_1Mirror(G', g) → G''Mirror(j, f_1) → j'Mirror(j, g) → j'_1Mirror(j', g) → j''Mirror(P, f_1) → H'Mirror(P, g) → H'_1Mirror(H', g) → H''Conic4Pkte1TangInP1(P, H', H'', H'_1, F) → l, pCoefficients(p) → zylKoeffPoint(p) → IOrthogonalLine(I, a) → mIntersect(m, c) → J,Intersect(m, b) → K, LLocus(K, I) → Ortslinie1Locus(L, I) → Ortslinie2
AI Drawing Prompt Reference
Draw the intersection figure of a sphere and a cone. Start by taking point B on the x-axis and point A at the intersection of the x-axis and y-axis. Draw circle c with A and B as centers. Then draw the tangent j to circle c, and take point E on circle c. Draw line g through E and B, intersecting j at M. Next, take points D and C on circle c, draw line f_1 through C and D, intersecting j at G. Then take point F_1 on the z-axis, draw sphere b with A and F_1 as centers, and plane d through A, F_1, and B, intersecting b to get line e. Draw plane h through A, F_1, and D, intersecting b to get line k. Draw line i through A and F_1. Mirror point F about f_1 to get G', about g to get G'_1, about G' to get G'', about j to get j', about j to get j'_1, and about j'_1 to get j''. Finally, draw the tangent line l through P, H', H'', H'_1, and F with coefficients zylKoeff, take point I on circle c, draw line m perpendicular to a through I, intersecting c at J, b at K and L, and draw the loci of K and I as Ortslinie1, and L and I as Ortslinie2.
The prompt above was compiled from the original drawing commands and is for reference only.