
Intersection of Quadratic and Linear Relations
Loading the math board and drawing, please wait…
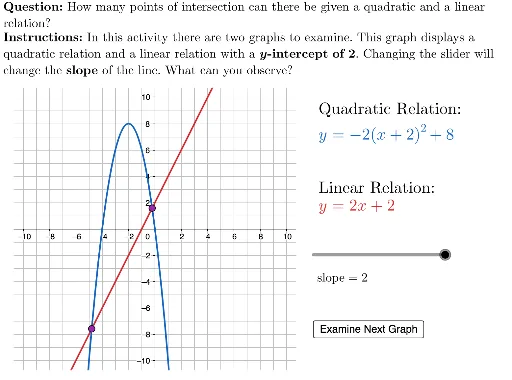
This example demonstrates the intersection points between a quadratic function and a linear function, highlighting dynamic changes. Key math concepts include function graphs, intersection solving, analytical geometry, and calculus. GeoGebra commands like LaTeX, If, Intersect, and Polygon are used to construct the graph dynamically with sliders and parameters. Suitable for high school and above mathematics education, focusing on function analysis, intersection calculation, and introductory calculus concepts.
GeoGebra Commands & Parameters
LaTeX("\textbf{Question: }How many points of intersection can there be given a quadratic and a linear\\relation?") → QUESTIONIf(isFirstGraph, "slope", "\(y\)-intercept") → changeIf(isFirstGraph, "\(y\)-intercept of 2", "slope of 2") → givenLaTeX((((("\textbf{Instructions: }In this activity there are two graphs to examine. This graph displays a\\quadratic relation and a linear relation with a \textbf{" * given) * "}. Changing the slider will\\change the \textbf{") * change) * "} of the line. What can you observe?")) → INSTRUCTIONSIntersect(firstQuadratic, firstLine) → A, BIntersect(secondQuadratic, secondLine) → C, DLaTeX((((("\text{" * QUESTION) * "\\") * INSTRUCTIONS) * "}")) → TEXTPolygon({(-10.75, -10.75), (-10.75, 10.75), (10.75, 10.75), (10.75, -10.75)}) → viewBox