
Line Intersecting a Cubic Function
Loading the math board and drawing, please wait…
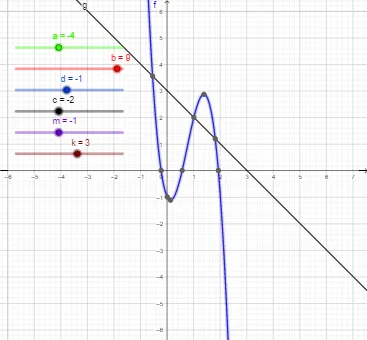
This example demonstrates how a straight line intersects the graph of a cubic function, with the number of intersection points changing dynamically as the line's position varies. The core mathematical concepts include the shape of cubic functions, solving intersections between a line and a curve, and the relationship between intersection points and roots of equations. The construction uses GeoGebra objects a, b, d, c, f, m, k, and g, where f represents the cubic function and g the line, with sliders or parameters controlling the slope m and intercept k to observe changes in intersection count (1, 2, or 3 points). It is suitable for high school students learning functions and equations, as well as for pre-calculus or introductory calculus demonstrations of line-curve interactions.
GeoGebra Commands & Parameters
Numeric a(-4)Numeric b(9)Numeric d(-1)Numeric c(-2)f(x) = (a * x^(3)) + (b * x^(2)) + (c * x) + dNumeric m(-1)Numeric k(3)g(x) = (m * x) + k
AI Drawing Prompt Reference
Draw a cubic function graph with the equation y = -4x^3 + 9x^2 - 2x - 1. Then draw a straight line with the equation y = -x + 3. Observe how the number of intersection points between the line and the cubic function changes as you adjust the slope and intercept.
The prompt above was compiled from the original drawing commands and is for reference only.