
Intersecting Straight Lines: Exploring Linear Graph Intersections
Loading the math board and drawing, please wait…
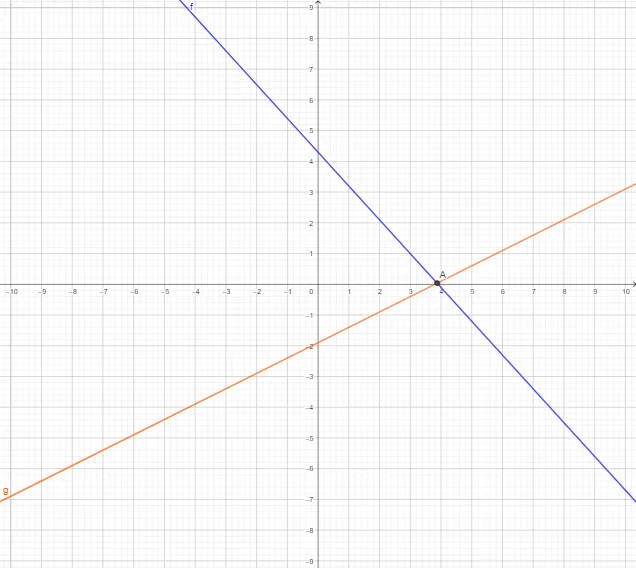
This example demonstrates the intersection of two straight lines, visually showing where linear function graphs cross on a plane, helping students grasp the geometric meaning of systems of equations. Core mathematical concepts include linear equations, slope, intercept, and solving for the coordinates of intersection points, bridging algebra and coordinate geometry. Construction highlights: using GeoGebra's Intersect command on line objects m, c, f, n, d, g, and marking point A, allowing dynamic observation of how intersections change with different line combinations. Suitable for middle school to high school students learning linear functions, systems of two-variable equations, or introductory analytic geometry, as well as for teachers demonstrating visualizations of line intersections in class.
GeoGebra Commands & Parameters
Intersect(f, g) → A
AI Drawing Prompt Reference
Draw a Cartesian coordinate plane with two straight lines that intersect, each representing a distinct linear function with different slopes and intercepts. Mark the point where the two lines cross with a clear dot. The graph should visually emphasize the intersection, showing how the lines meet at a single coordinate point. Keep the design clean and focused on the geometric relationship between the lines and their intersection, illustrating that the solution to a system of linear equations corresponds to this crossing point.
The prompt above was compiled from the original drawing commands and is for reference only.