
Interactive Quiz on Linear Inequalities in Two Variables
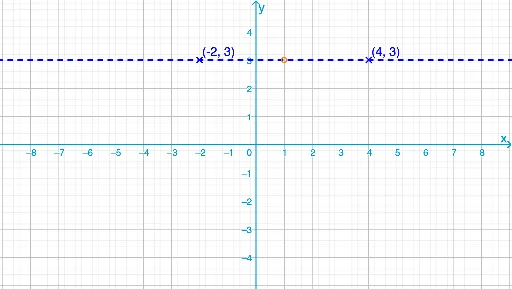
Loading the math board and drawing, please wait…
This GeoGebra example is an interactive quiz designed to test students' understanding of linear inequalities in two variables. It dynamically generates random questions where learners must determine whether a given point satisfies the inequality, compare the left and right sides, and identify the correct region. The core mathematical concepts include graphing linear inequalities, feasible regions, boundary lines, and the effect of inequality direction on the shaded area. The construction uses GeoGebra commands such as SelectedIndex, Shuffle, and If to randomize questions, Line, Midpoint, Circle, PointIn, ClosestPoint, and Intersect to draw boundary lines and test points, and Vector, LeftSide, and RightSide to compute side values. Interactive buttons and input fields provide immediate feedback. This resource is suitable for high school students studying coordinate geometry or inequalities, and can be used for classroom demonstrations or self-paced practice to reinforce visual and algebraic reasoning.
GeoGebra Commands & Parameters
SelectedIndex(listLevel) → levelShuffle(Sequence[(Mod[i, 13] - 6, Div[i, 13] - 4), i, 0, 116]) → L_3If(r ≤ 0.6, Line[RandomElement[L_1], RandomElement[L_2]], RandomElement[{f, g}]) → qLine(L_3(1), L_3(2)) → q2DynamicCoordinates(A', If[restrict, round(x(A')), round((10 * x(A'))) / 10], If[restrict, round(y(A')), round((10 * y(A'))) / 10]) → ADynamicCoordinates(B', If[restrict, round(x(B')), round((10 * x(B'))) / 10], If[restrict, round(y(B')), round((10 * y(B'))) / 10]) → BMidpoint(A, B) → MCircle(M, 1.5) → cPointIn(c) → P'ClosestPoint({M, c}, P') → QLine(A, B) → aIntersect(c, OrthogonalLine[M, a]) → E, FDynamicCoordinates(P', If[Distance[P', Q] < 0.1, x(Q), x(P')], If[Distance[P', Q] < 0.1, y(Q), y(P')]) → PVector(M, P) → uLeftSide(a) → leftRightSide(a) → rightIf(restrict, RandomElement[{LeftSide[q] > RightSide[q], LeftSide[q] < RightSide[q]}], RandomElement[{LeftSide[q2] > RightSide[q2], LeftSide[q2] < RightSide[q2]}]) → ansIf(leftBigger, LeftSide[a] > RightSide[a], leftSmaller, LeftSide[a] < RightSide[a]) → input
AI Drawing Prompt Reference
Create an interactive graph for learning linear inequalities, featuring dynamically generated random lines and test points, showing boundary lines, feasible regions, and the effect of inequality direction on shaded areas. First, draw two random lines and select one as a boundary line. Find the midpoint of the boundary line and draw a circle centered at this point. Randomly generate a point inside the circle and find its closest point on the circle's center. Compare the values on both sides of the boundary line to determine if the test point satisfies the inequality, and display feedback in the graph based on the result.
The prompt above was compiled from the original drawing commands and is for reference only.