
Interactive Probability Venn Diagram
Loading the math board and drawing, please wait…
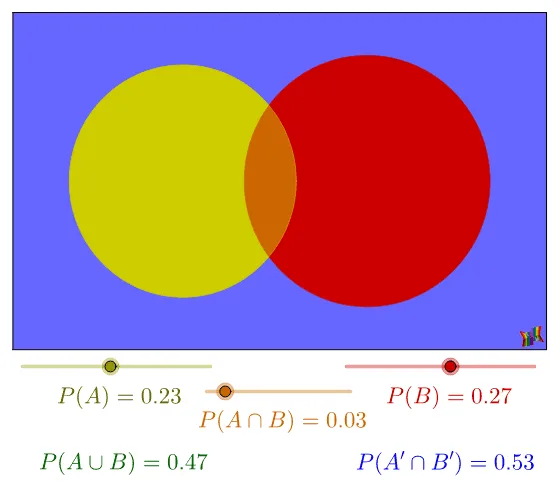
This GeoGebra example presents a proportional probability Venn diagram where users can directly control P(A), P(B), and P(A∩B). It dynamically adjusts the areas of the intersecting circles to visually represent set probabilities and their intersections. The construction leverages core GeoGebra commands including If, Circle, Polygon, Intersect, and CircleArc, combining circles, polygons, and arcs to enable real-time probability area manipulation. It is designed for high school probability and statistics units, geometric probability lessons, and students exploring the relationship between set theory and geometric modeling.
GeoGebra Commands & Parameters
If(Min[aPA, aPB] ≟ 0.26 ∧ (abs(Max[aPA, aPB] - 0.28) ≤ 0.01) ∧ aPAnB ≟ 0.25, 0.4, If[(Min[aPA, aPB] - aPAnB ≤ 0.02) ∧ (aPAnB > 0.26), (abs(r_A - r_B) + Max[r_A, r_B]) / 5, Max[r_A, r_B]]) → startvalueIf(r_A + r_B + A6 ≥ 1.618^(0.5), 1.618^(0.5) - r_A - r_B, If[aPAnB ≟ Min[aPA, aPB], Max[r_A, r_B] - Min[r_A, r_B], If[aPAnB ≟ 0, r_A + r_B, A6]]) → separationxIf(r_A + r_B + A6 ≥ 1.618^(0.5), If[aPAnB ≟ 0, ((r_A + r_B)^(2) - separationx^(2))^(0.5), (A6^(2) - (1.618^(0.5) - r_A - r_B)^(2))^(0.5)], 0) → separationyIf(r_A + r_B + A6 ≥ 1.618^(0.5), (separationy - r_A + r_B) / 2, 0) → yACircle(A, r_A) → PACircleCircle(B, r_B) → PBCirclePolygon(C, D, E, F) → poly1, c, d, e, fCircle(A, r_A) → PACircle2Circle(A, r_A) → PAGreenCircleCircle(B, r_B) → PBGreenCircleIntersect(PACircle, PBCircle) → G, H, ,CircleArc(A, H, G) → gIf(aPA ≟ 0.2 ∧ aPB ≟ 0.2 ∨ aPA ≟ 0.19 ∧ aPB ≟ 0.19, 0, Cell[SScol, SSrow]) → aMinPAnB
AI Drawing Prompt Reference
Please draw a probability Venn diagram with two intersecting circles. The circles represent sets A and B, and their intersection points represent the intersection of sets A and B. The arc connecting the intersection points represents the probability regions. Users can adjust the radii of the circles to change the probability values, making the diagram visually demonstrate set probabilities and their intersections. This diagram is suitable for teaching probability and geometric probability, helping students understand the relationship between set theory and geometric modeling.
The prompt above was compiled from the original drawing commands and is for reference only.