
Interactive Histogram Construction with Combinatorics and Set Theory
Loading the math board and drawing, please wait…
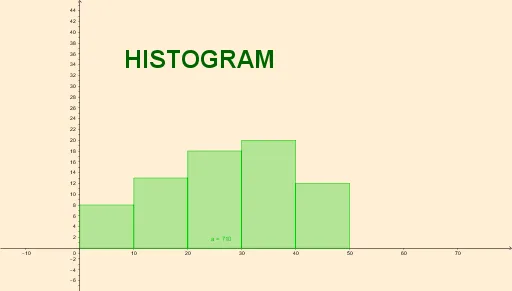
This GeoGebra example demonstrates how to construct a histogram using the Histogram command, linking it to combinatorial counting, set theory, and multiplication principles. The core mathematical concepts include data grouping, frequency distribution, geometric representation of histograms, and understanding the multiplication principle (frequency × bin width) through histogram areas, as well as counting problems in set operations. Construction highlights: from the summary, the Histogram command is used, along with multiple point objects (A1 to B6), lists l1 and l2, a parameter a, and text1, likely for dynamically adjusting bin boundaries or frequencies to update the histogram in real time. Suitable for middle school statistics, high school probability, and introductory college statistics courses, as well as for teachers demonstrating the connection between data visualization and counting principles.
GeoGebra Commands & Parameters
Histogram(l1, l2) → a
AI Drawing Prompt Reference
Create a histogram using a list l1 for data points and a list l2 for frequency distribution. First, create list l1 with data points and list l2 with frequencies for each data group. Then, use the Histogram command to draw the histogram. Adjust the data group boundaries with slider a. The area of the histogram represents frequency times group width, illustrating the connection between data visualization and counting principles.
The prompt above was compiled from the original drawing commands and is for reference only.