
Interactive Frequency Distribution: Random Data, Counts, and Pie Chart
Loading the math board and drawing, please wait…
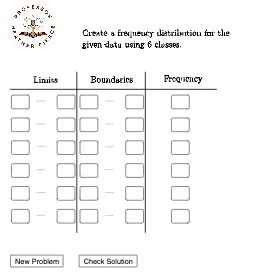
① This GeoGebra example demonstrates frequency distributions interactively: users can input or generate random natural numbers, and the app automatically counts the frequency of each value, displaying the results as a pie chart. ② Core mathematical concepts include frequency distribution, frequency counting, random variables, natural numbers, and data visualization via pie charts; multiplication may be involved in computing proportions or counts. ③ Construction highlights: the Random command generates random data, Min and Max set the data range, Textfield allows user input, Segment is used for drawing graphical elements, and CountIf counts occurrences meeting conditions. Multiple objects (A1 to C14) organize the data and chart. ④ Suitable for middle and high school statistics and probability lessons, as well as math lab activities for exploring randomness and distribution patterns.
GeoGebra Commands & Parameters
Random(50, 99) → A1Random(50, 99) → B1Random(50, 99) → C1Random(50, 99) → C2Random(50, 99) → B2Random(50, 99) → A2Random(50, 99) → A3Random(50, 99) → B3Random(50, 99) → C3Random(50, 99) → C4Random(50, 99) → B4Random(50, 99) → A4Random(50, 99) → A5Random(50, 99) → B5Random(50, 99) → C5Random(50, 99) → C6Random(50, 99) → B6Random(50, 99) → A6Random(50, 99) → A7Random(50, 99) → B7Random(50, 99) → C7Random(50, 99) → C8Random(50, 99) → B8Random(50, 99) → A8Random(50, 99) → A9Random(50, 99) → B9Random(50, 99) → C9Random(50, 99) → C10Random(50, 99) → B10Random(50, 99) → A10Random(50, 99) → A11Random(50, 99) → B11Random(50, 99) → C11Random(50, 99) → C12Random(50, 99) → B12Random(50, 99) → A12Random(50, 99) → A13Random(50, 99) → B13Random(50, 99) → C13Random(50, 99) → C14Random(50, 99) → B14Random(50, 99) → A14Random(50, 99) → A15Random(50, 99) → B15Random(50, 99) → C15Min(Data) → minMax(Data) → maxTextfield(lower1) → InputBox1Textfield(lower2) → InputBox2Textfield(lower3) → InputBox3Textfield(lower4) → InputBox4Textfield(lower5) → InputBox5Textfield(lower6) → InputBox6Textfield(upper1) → InputBox7Textfield(upper2) → InputBox8Textfield(upper3) → InputBox9Textfield(upper4) → InputBox10Textfield(upper5) → InputBox11Textfield(upper6) → InputBox12Segment(A, B) → fSegment(C, D) → gTextfield(lboundary1) → InputBox13Textfield(lboundary2) → InputBox14Textfield(lboundary3) → InputBox15Textfield(lboundary4) → InputBox16Textfield(lboundary5) → InputBox17Textfield(lboundary6) → InputBox18Textfield(uboundary1) → InputBox19Textfield(uboundary2) → InputBox20Textfield(uboundary3) → InputBox21Segment(E, F) → hTextfield(frequency1) → InputBox25Textfield(frequency2) → InputBox26Textfield(frequency3) → InputBox27Textfield(frequency4) → InputBox28Textfield(frequency5) → InputBox29Textfield(frequency6) → InputBox30Textfield(uboundary4) → InputBox22Textfield(uboundary5) → InputBox23Textfield(uboundary6) → InputBox24CountIf(l1 ≤ x ≤ u1, Data) → f1CountIf(l2 ≤ x ≤ u2, Data) → f2CountIf(l3 ≤ x ≤ u3, Data) → f3CountIf(l4 ≤ x ≤ u4, Data) → f4CountIf(l5 ≤ x ≤ u5, Data) → f5CountIf(l6 ≤ x ≤ u6, Data) → f6
AI Drawing Prompt Reference
Create a frequency distribution chart for random data, generating natural numbers between 50 and 99, counting the occurrences of each value, and displaying the results with a pie chart. First, generate 15 random numbers, then find the minimum and maximum values among them, and finally let the user input a text box to show the data range.
The prompt above was compiled from the original drawing commands and is for reference only.