
Interactive Exploration of Secant Slope and Area Division for Quadratic Function
Loading the math board and drawing, please wait…
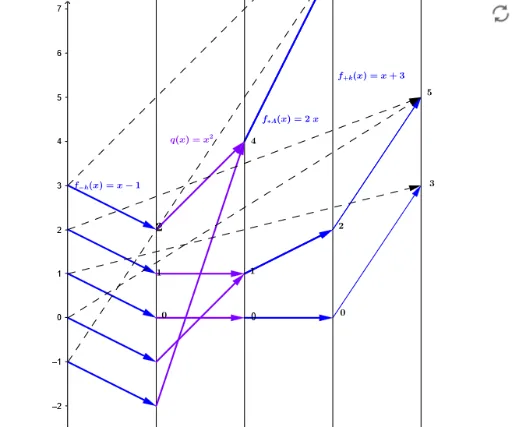
①This example demonstrates the dynamic variation of the secant line slope on a quadratic function graph, along with the area division of triangles formed by the secant and coordinate axes. ②Core mathematical concepts include quadratic functions, secant slope, area division, scalene triangles, and boxplot statistical representation. ③Construction highlights: using GeoGebra commands such as Point, Vector, Textfield, Sequence, and Zip to create points, vectors, text fields, and sequences; objects include the quadratic function f, parameters h, k, R, points A, B, C, secant line g, slope-related objects m, a, b, and input boxes inputBox1 and inputBoxf for dynamic parameter adjustment; sequences and lists list1-list4 generate data for boxplot visualization. ④Suitable for high school or early college students to explore the geometric meaning of secant slopes and area division, and for interdisciplinary teaching combining geometry and statistics.
GeoGebra Commands & Parameters
Point(yAxis) → A_1Vector(A_1, B) → uVector(B, C) → vTextfield(m) → inputBox1Textfield(g) → inputBoxfSequence(n_0, n_1) → NZip(Vector[(6, m(q(R(i)))), (8, g(m(q(R(i)))))], i, N) → list1Zip(Vector[(4, q(R(i))), (6, m(q(R(i))))], i, N) → list2Zip(Vector[(0, i), (2, R(i))], i, N) → list3Zip(Vector[(2, R(i)), (4, q(R(i)))], i, N) → list4Zip(Vector[(0, i), (8, g(m(q(R(i)))))], i, N) → list5