
Interactive Demonstration of Hyperbola and Correlation Statistics
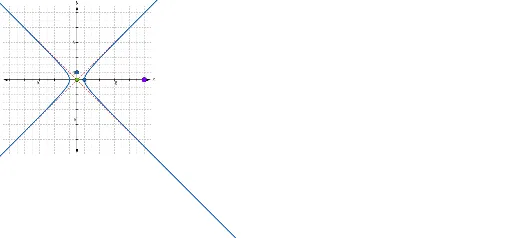
Loading the math board and drawing, please wait…
① This GeoGebra example dynamically demonstrates the geometric construction of a hyperbola while integrating statistical concepts such as correlation, geometric mean, and histograms, offering a cross-disciplinary visualization. ② Core mathematical concepts include the standard equation and asymptotes of a hyperbola, geometric mean, correlation coefficient, histogram representation, rational numbers, and similarity transformations. ③ Construction highlights: The example uses the If and Sequence commands to generate sequences, defines points T, A, V, B and parameters h, a, k, b, c, transval, gsize; builds coordinate grids via gridlines, ticks, xaxis, yaxis; uses text objects text1 through text3_4 for annotations; sets f1 and f2 as hyperbola branches, corr for correlation, asymptotes for asymptote lines, and check for interactive validation. ④ Suitable for high school to early college students to explore connections between conic sections and statistics, and as a reference for educators creating interactive lessons.
GeoGebra Commands & Parameters
If(x(T) ≟ 0, -1, 1) → transvalSequence({Segment[(k, (-1.1 * gsize)), (k, (1.1 * gsize))], Segment[((-1.1 * gsize), k), ((1.1 * gsize), k)]}, k, (-gsize), gsize) → gridlinesIf(transval ≟ 1, (h - c, k), (h, k + c)) → f1If(transval ≟ 1, (x(V) + c, y(V)), (x(V), y(V) - c)) → f2Sequence({Segment[(-0.15, k), (0.15, k)], Segment[(-0.15, (-k)), (0.15, (-k))], Segment[((-k), -0.15), ((-k), 0.15)], Segment[(k, -0.15), (k, 0.15)]}, k, 1, gsize) → ticksIf(transval ≟ 1, Hyperbola[f1, f2, A], Hyperbola[f1, f2, B]) → d