
Logarithmic Function and Geometric Transformation Demo
Loading the math board and drawing, please wait…
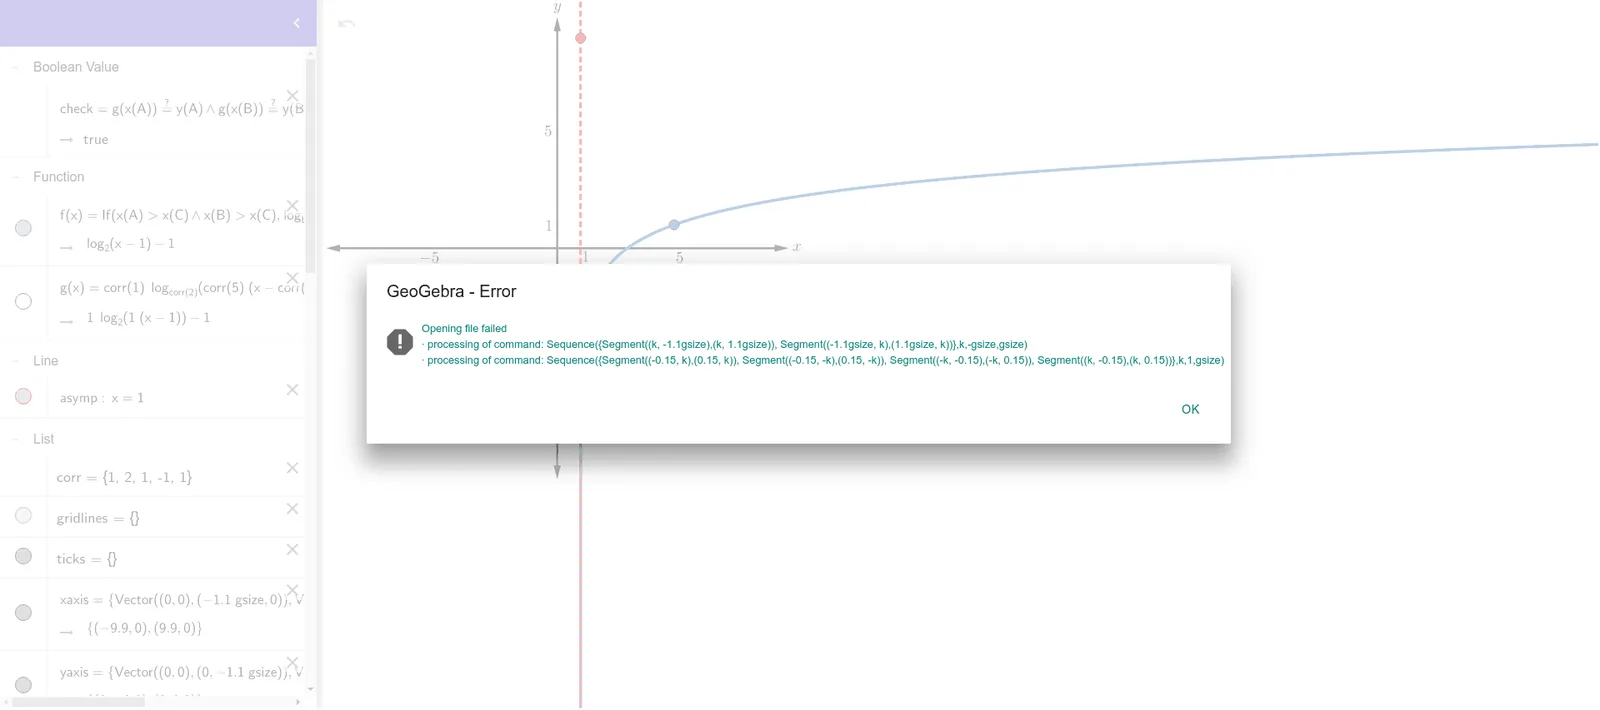
This example demonstrates the logarithmic function graph combined with geometric transformations like dilation and angle changes. It involves core concepts such as logarithmic properties, median value, mode, general quadrilateral, dilation, and angle calculations. GeoGebra commands like Max, Sequence, and If are used to construct points, coordinates, texts, axes, etc. Suitable for high school mathematics teaching to understand the relationship between function transformations and geometric figures.
GeoGebra Commands & Parameters
Max(x(A), (2 * x(C)) - x(A)) → x1Max(x(B), (2 * x(C)) - x(B)) → x2Sequence({Segment[(k, (-1.1 * gsize)), (k, (1.1 * gsize))], Segment[((-1.1 * gsize), k), ((1.1 * gsize), k)]}, k, (-gsize), gsize) → gridlinesSequence({Segment[(-0.15, k), (0.15, k)], Segment[(-0.15, (-k)), (0.15, (-k))], Segment[((-k), -0.15), ((-k), 0.15)], Segment[(k, -0.15), (k, 0.15)]}, k, 1, gsize) → ticksIf(x(A) > x(C) ∧ x(B) > x(C), log(b, x - c) + d, x(A) < x(C) ∧ x(B) < x(C), log(b, c - x) + d) → f