
Interactive Demo of Linear Regression and Derivatives
Loading the math board and drawing, please wait…
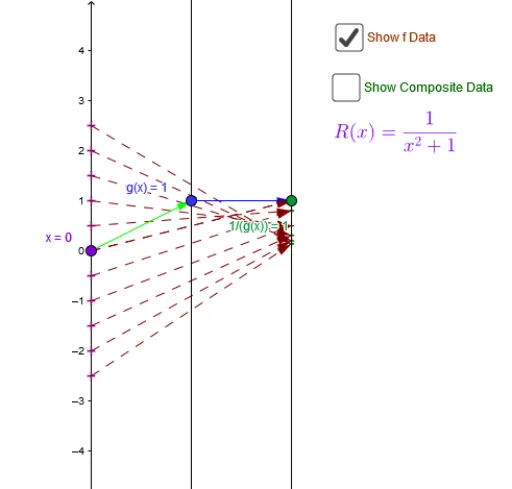
This example demonstrates the calculation process of linear regression models and derivatives through interactive graphics; involves core math concepts like linear regression, derivatives, 2D vectors, and indefinite integrals; constructed using GeoGebra commands/objects such as Point, Vector, Textfield, Segment, Sequence, Zip; suitable for high school and above learners to understand data analysis and calculus applications.
GeoGebra Commands & Parameters
Point(yAxis) → A_xVector(A_x, B) → uVector(B, C) → vTextfield(f1) → inputBox1Textfield(f2) → inputBox2Vector(C, D) → wTextfield(f3) → inputBox3Textfield(A) → inputBox4_1Segment(Pole, Asym) → iVector(A_{xs}, A_{f(xs)}) → jSegment(P, hfg_x) → mVector(A_x, C) → zSequence(0, num) → NZip(h + k - num / 4, k, N / 2) → x_*Zip(Vector[P, Q], P, xmd_*, Q, umd_*) → uarr_*Zip(Vector[P, Q], P, umd_*, Q, ymd_*) → yarr_*Zip(Vector[P, Q], P, xmd_*, Q, ymd_*) → xyarr_*Zip((P, Q), P, x_*, Q, y_*) → xyPT_*