
Tangent Planes and Linear Approximations Example by Noah
Loading the math board and drawing, please wait…
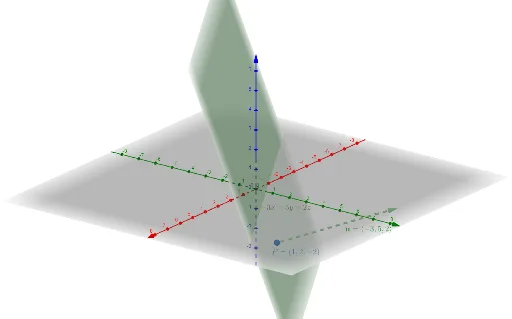
This example demonstrates how to plot tangent planes and linear approximations for a function in 3D space. Key math concepts include tangent plane equations, linear approximations, and vector operations. It uses GeoGebra's Vector command with objects a, P, and u to represent direction vectors, points, and position vectors respectively. Suitable for university calculus courses or advanced mathematics learning.
GeoGebra Commands & Parameters
Vector((1, 2, -2), (1, 2, -2) + (-3, 5, 2)) → u
AI Drawing Prompt Reference
Plot a 3D graph showing tangent planes and linear approximations for a function, illustrating the relationship between direction vectors, points, and position vectors. Use a vector command to create three vectors representing these elements and display how they collectively form the graphical representation of the tangent plane and linear approximation.
The prompt above was compiled from the original drawing commands and is for reference only.