
Tangent Vectors Visualization on Polynomial Curves
Loading the math board and drawing, please wait…
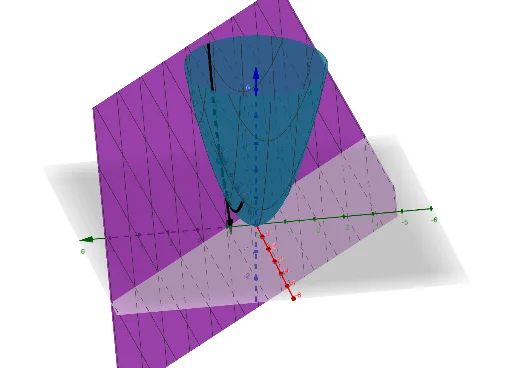
This GeoGebra example visualizes tangent vectors on a polynomial curve, illustrating the geometric interpretation of derivatives. Key mathematical concepts involve vector analysis, calculus, and coordinate geometry. The construction utilizes the CurveCartesian command to define the function graph and the Vector command to generate tangent vectors at specific points. Interactive objects a, A, b, d, u, c allow dynamic manipulation. Ideal for high school or college calculus students to understand the relationship between slopes and tangent lines.
GeoGebra Commands & Parameters
Vector((1, 1, 2), (1 + cos(d), 1 + sin(d), 2 + (2 * cos(d)) + (2 * sin(d)))) → uCurveCartesian(1 + (cos(d) * t), 1 + (sin(d) * t), (1 + (cos(d) * t))^(2) + (1 + (sin(d) * t))^(2), t, -2, 2) → c