
Interactive Compound Amount and Interest Calculator
Loading the math board and drawing, please wait…
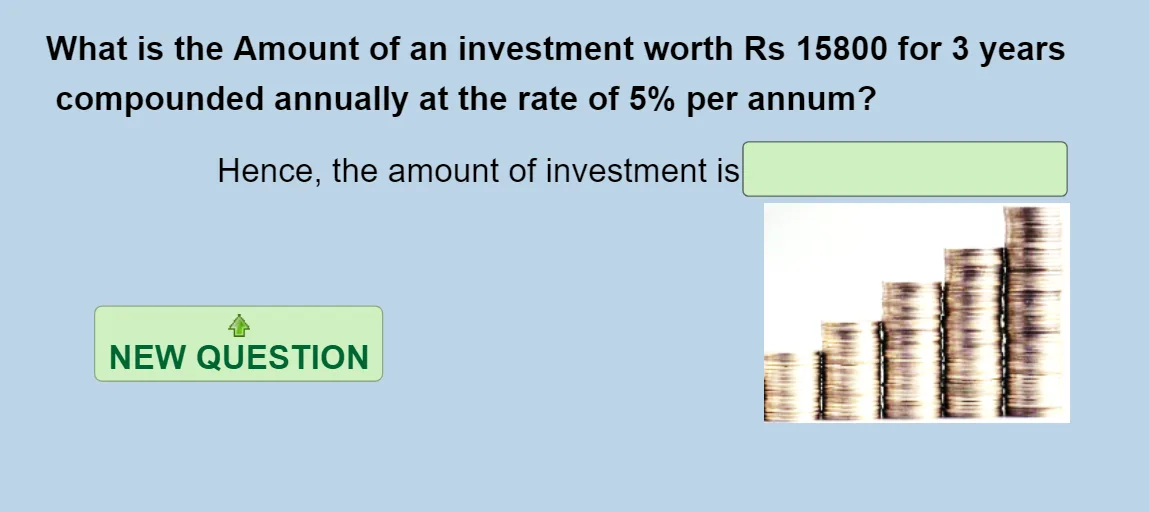
This GeoGebra example demonstrates the dynamic accumulation of compound amount over time, showing how principal and accrued interest grow exponentially under compound interest rules. The core mathematical concepts include compound interest, principal, interest rate, compounding periods, and exponential growth functions. Constructed using GeoGebra commands like `Random` and `Textfield`, the interface features interactive objects such as `InputBox1` for user inputs, buttons like `button1` to trigger calculations, and text fields (`text1` to `text3`) and images (`pic1`) to display results dynamically based on variables `pri` (principal), `rate` (interest rate), and `time`. It is highly suitable for high school mathematics, financial literacy courses, and introductory economics classes to visualize the power of compound interest.
GeoGebra Commands & Parameters
Random(1, 9) → aRandom(0, 9) → bRandom(1, 9) → cRandom(1, 3) → timeRandom(5, 15) → rateTextfield(sans) → InputBox1
AI Drawing Prompt Reference
Create a graphic showing compound interest growth. Include an input box for principal, rate, and time, and a text box to display the calculated result. The graphic should dynamically show how the amount grows over time using sliders to adjust rate and time. Ensure the graphic clearly illustrates the concept of compound interest for educational purposes.
The prompt above was compiled from the original drawing commands and is for reference only.