
Integration and Area Under a Curve
Loading the math board and drawing, please wait…
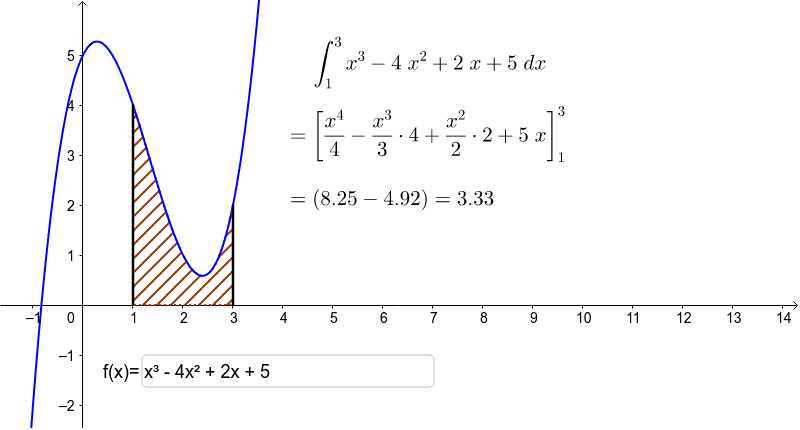
This example visually demonstrates the concept of integration, which is the area under a curve. Key mathematical concepts include functions, integration, and calculus. Using GeoGebra commands such as Segment, Integral, and Textfield, users can dynamically change the function and interval to observe changes in the integral value. Suitable for high school and above students to learn about integration concepts and applications.
GeoGebra Commands & Parameters
Segment(A, B) → mSegment(A_1, B_1) → m_1Integral(f, x(A), x(A_1)) → IntIntegral(f, x) → gTextfield(f) → inputBox1
AI Drawing Prompt Reference
Draw the graph of function f(x), and calculate its integral over the interval [A, B], showing the integral value. Create sliders to change the values of A and B, and observe the changes in the integral value. Add a text box to input the function expression f(x), and display the integral function g(x).
The prompt above was compiled from the original drawing commands and is for reference only.