
Integral and Rectangle Accumulation Demo
Loading the math board and drawing, please wait…
In collections
Rate & Accumulation Yr 4 Much&Fast
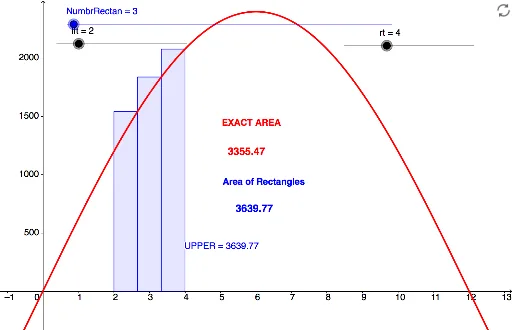
This example demonstrates the process of approximating an integral by increasing the number of rectangles, visually showing the accumulation effect. Core mathematical concepts include integral, rectangle approximation (left, middle, right), linear functions, and geometric distribution. Construction highlights involve GeoGebra commands like Integral for exact integration, LeftSum, TrapezoidalSum, UpperSum for different rectangle approximations, and Text, Textfield for displaying results. Objects include f, lft, rt, Exact, NumbrRectan, LOWer, Trapz, UPPER, text1, text3, text4, inputBox1, text2. Suitable for high school and above students to understand integral concepts and numerical methods, or for teaching demonstrations.
GeoGebra Commands & Parameters
Integral(f, lft, rt) → ExactLeftSum(f, lft, rt, NumbrRectan) → LOWerTrapezoidalSum(f, lft, rt, NumbrRectan) → TrapzUpperSum(f, lft, rt, NumbrRectan) → UPPERText(UPPER) → text1Textfield(f) → inputBox1Text(Exact) → text2
AI Drawing Prompt Reference
Draw a function graph and demonstrate the process of approximating an integral by increasing the number of rectangles. Include the exact integral curve, left rectangle approximation, trapezoidal approximation, and right rectangle approximation, with text displaying different approximation values and the function expression. Use a slider to control the number of rectangles, visually showing the accumulation effect.
The prompt above was compiled from the original drawing commands and is for reference only.