
Integer Addition and Subtraction on a Number Line by byui
Loading the math board and drawing, please wait…
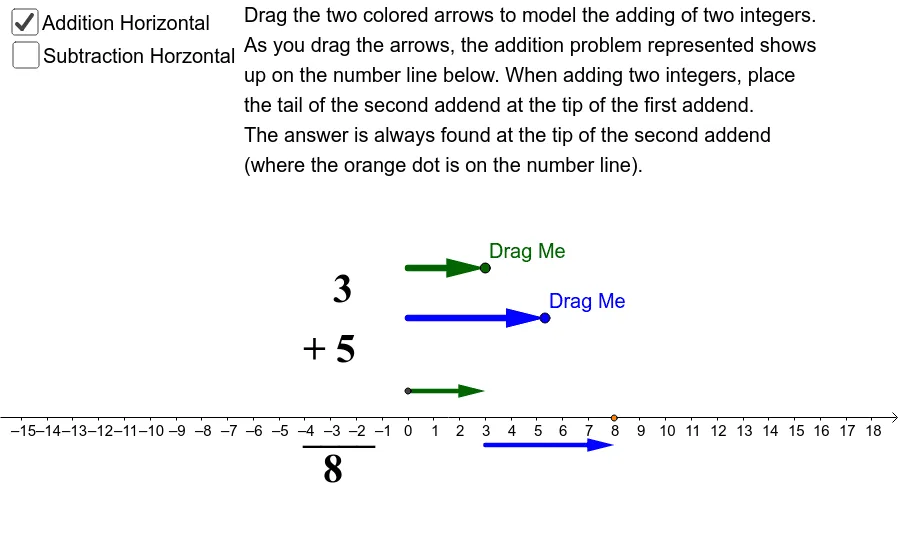
① This example demonstrates addition and subtraction of integers on a horizontal number line, allowing users to visually track how operations shift a point along the line. ② Core math concepts include integer arithmetic, number line representation, distance and direction, and the geometric interpretation of adding (moving right) and subtracting (moving left). ③ Construction highlights: uses GeoGebra commands such as Point, Line, Distance, Vector, Translate, Mirror, If, and Text to build the number line, control point movement, and display dynamic expressions; key objects include D, F, H, G, E, A, B, C, distances distanceFG and distanceDE, and text labels TextFG and TextDE. ④ Suitable for upper elementary to middle school students learning integer operations, and useful for classroom demonstrations or self-paced exploration to build number sense and operational intuition.
GeoGebra Commands & Parameters
Point(yAxis) → DPoint(yAxis) → FPoint(yAxis) → HOrthogonalLine(H, yAxis) → dPoint(d) → GDistance(F, G) → distanceFGOrthogonalLine(D, yAxis) → kPoint(k) → EDistance(D, E) → distanceDEPoint(xAxis) → AOrthogonalLine(A, xAxis) → aPoint(a) → BLine(B, xAxis) → bIntersect(b, a) → CCircle(C, round(distanceFG)) → eIntersect(e, b, 1) → JMirror(J, xAxis) → J'Intersect(e, b, 2) → IMirror(If[j > 0, I, J], xAxis) → I'Vector(D, E) → uVector(F, G) → vVector(C, I) → wVector(C, J) → fIf(h ≟ 0, 0, j) → Num1Circle(If[j > 0, I', J'], l) → pOrthogonalLine(I', yAxis) → qIntersect(p, q, 1) → KVector(I', K) → rIntersect(p, q, 2) → LVector(I', L) → sIf(m ≟ 0, 0, o) → Num2OrthogonalLine(If[o > 0, K, L], xAxis) → tIntersect(t, xAxis) → MVector(L, I') → v_1Translate(I', v_1) → I''Vector(I'', I') → u_1OrthogonalLine(If[o < 0, I'', L], xAxis) → b_1Intersect(b_1, xAxis) → N
AI Drawing Prompt Reference
Draw a horizontal number line with integer addition and subtraction. Place two vertical guide lines above the line, each with a movable starting point. From these points, draw arrows extending right for positive values and left for negative values. On the number line, show a main movable point controlled by sliders, with a dynamic expression displayed. Include a circle that helps visualize distances, and project points from the circle vertically down to the number line to show resulting positions. Use distinct colors for positive and negative directions, and add text labels showing the current operation and result.
The prompt above was compiled from the original drawing commands and is for reference only.