
Inequalities Input and Graph Demo
Loading the math board and drawing, please wait…
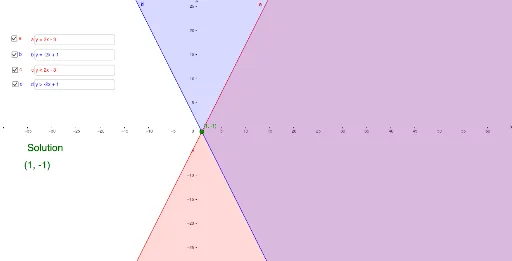
This example demonstrates the input and graphical representation of inequalities in trapezoids and general quadrilaterals. It involves core math concepts like inequalities, function graphs, exponential functions, and coordinate geometry. Construction highlights include using GeoGebra commands like Textfield, Intersect, Text, along with objects such as a, b, c, e, f, g, h, inputBox1, inputBox2, inputBox3, d, inputBox4, A, text1, text2. Suitable for high school students and educators for teaching and exploring the relationship between inequalities and geometric shapes.
GeoGebra Commands & Parameters
Textfield(a) → inputBox1Textfield(b) → inputBox2Textfield(c) → inputBox3Textfield(d) → inputBox4Intersect(a, b) → AText(A) → text1
AI Drawing Prompt Reference
Create a demonstration showing the input and graphical representation of inequalities in trapezoids and general quadrilaterals. Include input boxes for parameters, then draw the trapezoids and quadrilaterals based on these inputs, highlighting their intersection points. Add text labels near the graph to indicate key points and inequality relationships, suitable for educational purposes.
The prompt above was compiled from the original drawing commands and is for reference only.