
Inequalities Graphing Exploration
Loading the math board and drawing, please wait…
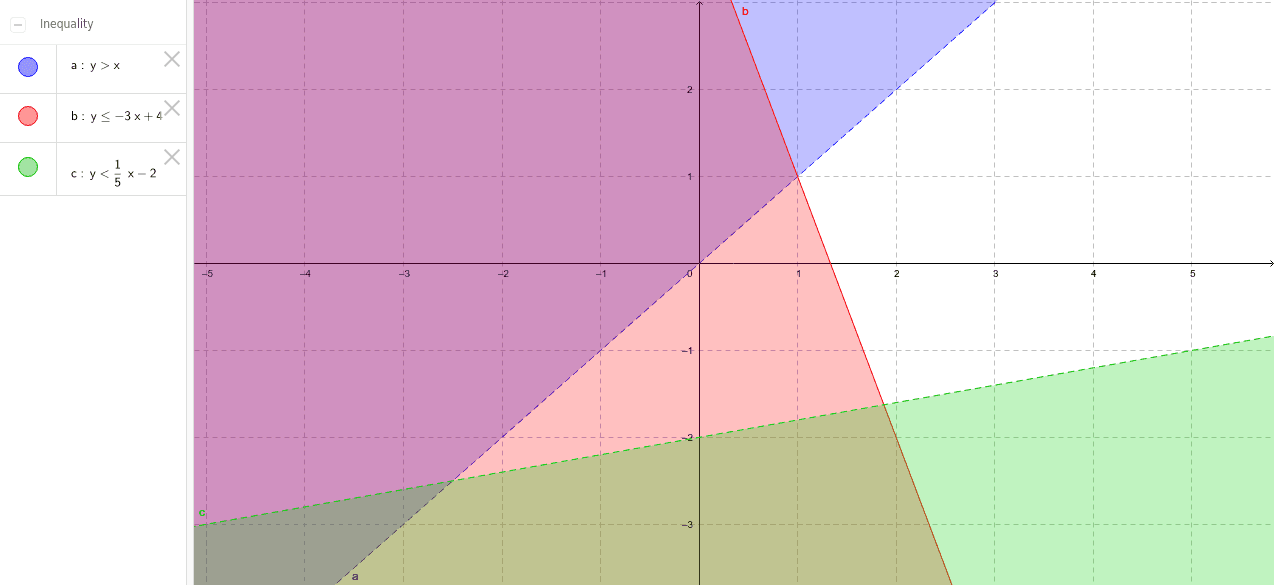
This example demonstrates how to graph inequalities in a coordinate system and observe the solution set regions. Key math concepts include inequalities, function graphs, and area representation. Construction highlights involve using GeoGebra objects a, b, c to represent variables, sliders for dynamic parameter adjustment, and visualizing inequality solution set changes. Suitable for high school students learning inequality graphical representation and parameter effects, or introductory calculus teaching.
GeoGebra Commands & Parameters
a(x, y) = y > xb(x, y) = y ≤ (-3 * x) + 4c(x, y) = y < (1 / 5 * x) - 2