
Independent Probability Calculator
Loading the math board and drawing, please wait…
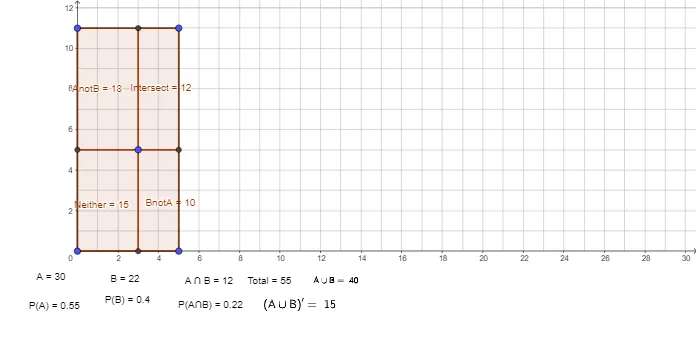
This example demonstrates how to use GeoGebra to calculate the probability of independent events. Core math concepts include probability theory, independent events, and probability calculation formulas. Construction highlights involve commands like Segment, Polygon, Intersect, and objects e, f, g, h, i, e_1, e_2, e_3. Suitable for high school and above students to learn basic probability statistics principles and for educational demonstrations.
GeoGebra Commands & Parameters
Segment(C, D) → fSegment(D, B) → gSegment(A, B) → hSegment(A, C) → iPolygon(E, H, D, F) → Intersect, e, h_1, d, f_1Polygon(E, H, B, G) → BnotA, e_1, h_2, b, g_1Polygon(E, I, C, F) → AnotB, e_2, i_1, c, f_2Polygon(E, I, A, G) → Neither, e_3, i_2, a, g_2
AI Drawing Prompt Reference
Draw a geometric diagram consisting of four triangles representing four scenarios of independent events: both occurring, only the first occurring, only the second occurring, and neither occurring. Use sliders to control the size and position of each part, connecting key points with line segments, and label the probability areas of each section. Start by creating a basic quadrilateral frame, then fill in the four triangles, and label the intersection points and area names.
The prompt above was compiled from the original drawing commands and is for reference only.