
Image of a Square Under a Complex Function
Loading the math board and drawing, please wait…
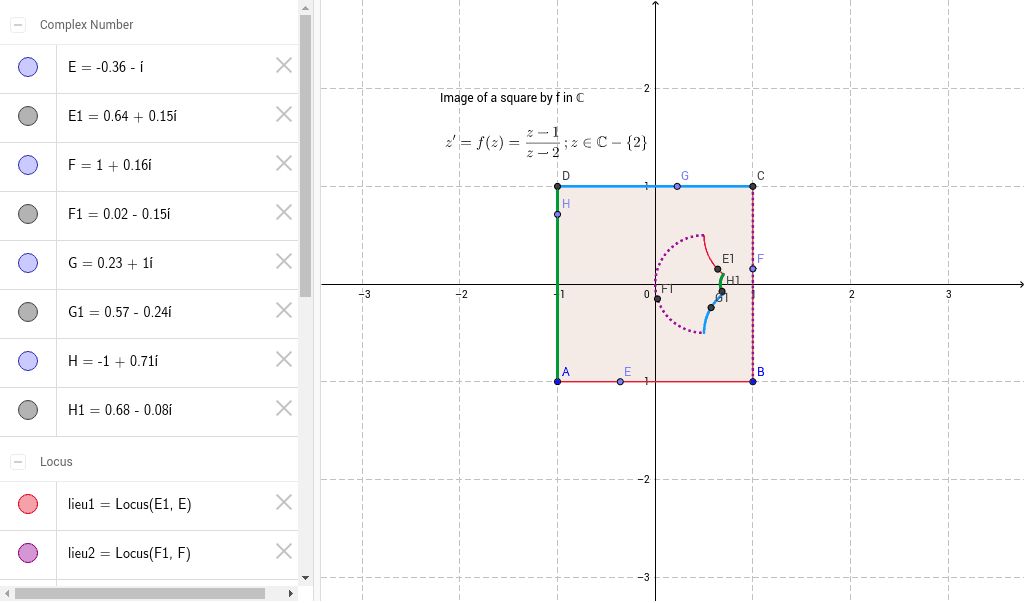
This GeoGebra example demonstrates the image of a square in the complex plane under a complex function, illustrating how the four line segments defining the square are mapped into new geometric figures. Core mathematical concepts include complex numbers, complex functions, geometric transformations in the complex plane, polygons, and loci. The construction relies on GeoGebra commands Polygon to build the square (poly1), Point to define vertices such as A and B along with points C, D, E, F, G, H, and Locus to generate image point trajectories lieu1 through lieu4, supported by objects a, b, c, d and text labels texte1 and texte2 for annotation. It is suitable for high school advanced mathematics or university introductory complex analysis courses, helping students visualize conformal mappings and the geometric effect of complex transformations.
GeoGebra Commands & Parameters
Polygon(A, B, 4) → poly1, a, b, c, d, C, DPoint(a) → EPoint(b) → FPoint(c) → GPoint(d) → HLocus(E1, E) → lieu1Locus(F1, F) → lieu2Locus(H1, H) → lieu3Locus(G1, G) → lieu4
AI Drawing Prompt Reference
Draw a square in the complex plane with its four vertices connected to form a closed shape. Place a moving point on each of the four sides of the square, one per side. For each moving point, apply a given complex function to obtain its image point, and trace the path of these image points as the moving points travel along the sides, resulting in four curves. These curves illustrate how the square's boundary is transformed under the complex function, possibly appearing as curved or deformed shapes. Also label the square's vertices and sides, and add text annotations to clearly show the correspondence between the original and mapped figures.
The prompt above was compiled from the original drawing commands and is for reference only.