
IM Algebra 1 2.21 Practice: Graphing Linear Inequalities in Two Variables (Part
Loading the math board and drawing, please wait…
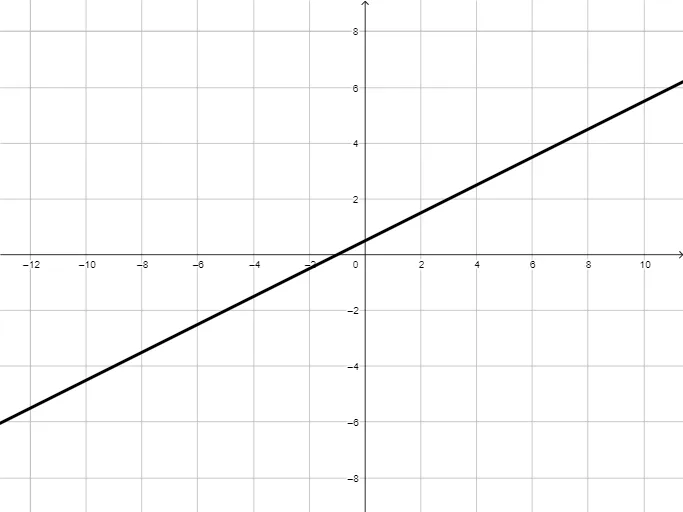
① This example demonstrates how to graph the solution region of a linear inequality in two variables on the Cartesian plane, using boundary lines and shaded highlights to visualize the feasible area. ② Core mathematical concepts include linear inequalities, boundary lines, half-plane representation of solution sets, and how inequality symbols affect the shading direction. ③ Construction details: Based on the construction summary, GeoGebra commands Point and Line are used to create objects eq1, f, l1, and points A, B, C, D, with highlight1 and highlight2 to emphasize different regions, effectively building a clear visual demonstration. ④ Suitable for upper middle school or high school students learning Algebra 1, particularly for practicing graphing linear inequalities; it can serve as a classroom demonstration or self-study material to reinforce the geometric interpretation of inequality solutions.
GeoGebra Commands & Parameters
Point(eq1) → DPoint(eq1) → CLine(B, A) → f
AI Drawing Prompt Reference
Draw a Cartesian plane and graph a linear inequality as a line. Then shade the solution region to represent the feasible area. First, draw the line for the inequality eq1, then mark two points D and C on the line. Finally, draw a line f through points B and A to represent eq1.
The prompt above was compiled from the original drawing commands and is for reference only.