
IM Alg1 2.12 Practice: Writing and Graphing Systems of Linear Equations
Loading the math board and drawing, please wait…
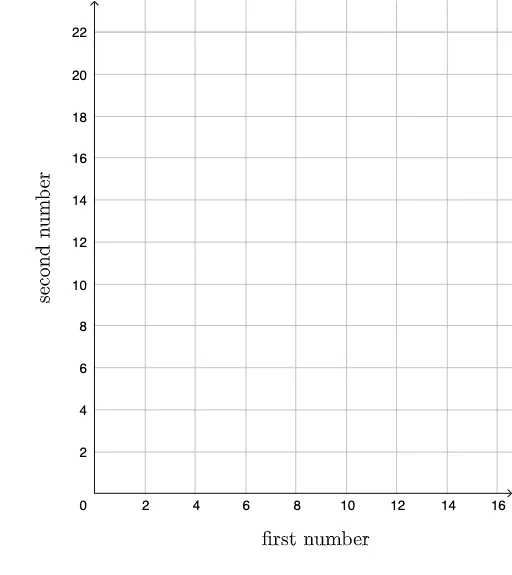
This GeoGebra example demonstrates how to write systems of linear equations from real-world contexts and graph them to visualize the solution. The core mathematical concepts include linear equations, systems of equations, slope-intercept form, and the interpretation of intersection points as solutions. The construction uses text objects (text1, text2) to label equations or provide instructions, likely accompanied by hidden or implicit line graphs. It is suitable for middle school advanced or high school introductory algebra, helping students practice translating word problems into equation systems and verifying solutions graphically.
AI Drawing Prompt Reference
Draw a system of two linear equations represented by two lines. First, input two linear equations, for example, y = 2x + 1 and y = -x + 4. Then, plot these two lines and observe their intersection point, which is the solution to the system. Use text objects to label these equations and show their intersection point on the graph.
The prompt above was compiled from the original drawing commands and is for reference only.