
IM 7.6.3 Lesson: Reasoning about Equations with Tape Diagrams
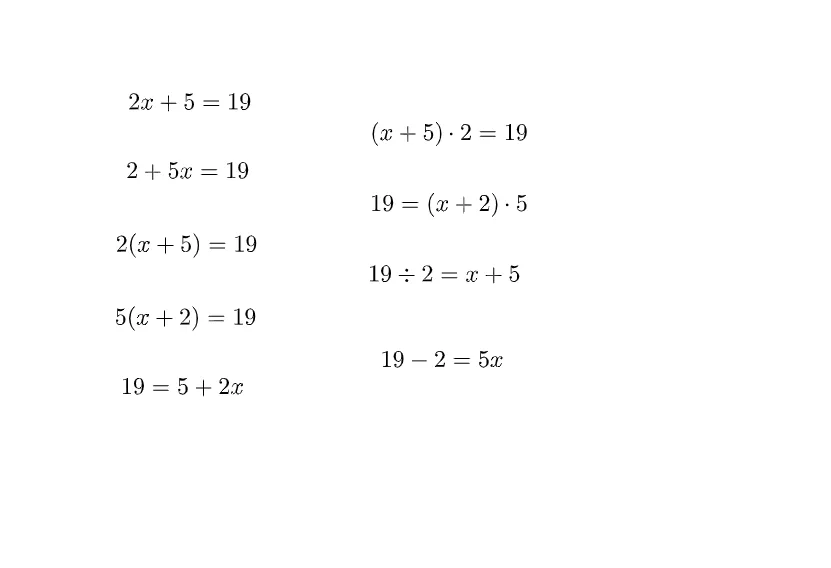
Loading the math board and drawing, please wait…
① This example demonstrates how tape diagrams (bar models) can be used to visually represent and reason about the structure and solution of linear equations. ② Core mathematical concepts include equation modeling, equality relationships, visualization of variables and constants, rational number operations, and equation‑solving strategies. ③ Construction highlights: the GeoGebra applet creates a series of text objects (text1 through text9) to label diagram segments, display numeric values, and show the correspondence between the two sides of the equation, with dynamic positioning enabling step‑by‑step illustration. ④ Suitable for middle‑school (grade 7) algebra introduction, teacher lesson preparation, student self‑exploration, or interactive classroom demonstration.
AI Drawing Prompt Reference
Draw a bar diagram to represent linear equations. Include multiple bar segments, each labeled with values, to show the relationship between the two sides of the equation. The segments should adjust dynamically to illustrate the solution process. Ensure the diagram is clear and easy to understand.
The prompt above was compiled from the original drawing commands and is for reference only.