
IM 6.4.8 Practice: How Much in Each Group? (Part 1)
Loading the math board and drawing, please wait…
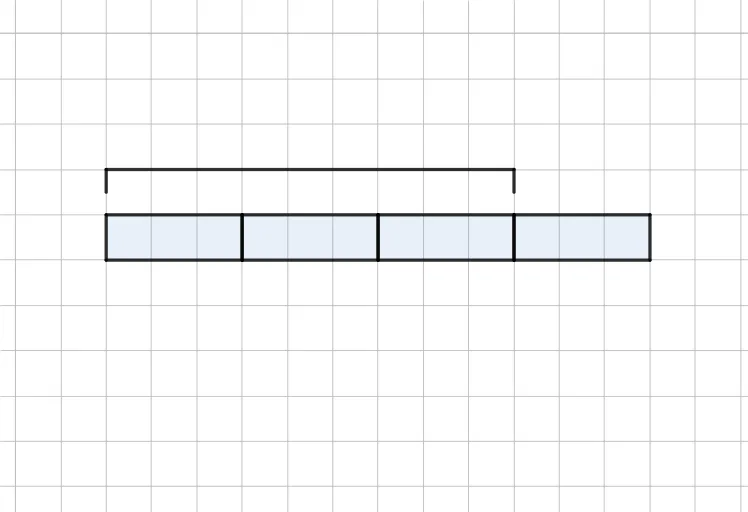
① This example demonstrates how to visually model the division and fraction problem of 'how much in each group?' using geometric figures (quadrilaterals and their segments), serving as a practice exercise in mathematical modeling. ② Core mathematical concepts include division of rational numbers (fractions), equal sharing, unitizing, and the relationship of equal parts within geometric shapes, along with basic properties of general quadrilaterals. ③ Construction highlights: Based on the construction summary, the example uses the CustomQuadrilateral and Segment commands, creating multiple quadrilaterals (q1, q2, q3, q4) and their sides (f, g, h, i, j, k, l, m, n, p, q, r, s, t, etc.), with points (E, F, G, H, I, J, K, L, M, N, O, P, Q, R) and segments to build the figures, likely representing grouping or equal partitioning. ④ Suitable for middle school (Grade 6) mathematics practice, helping students understand the meaning of fraction division and equal distribution, and can be used for classroom demonstrations or student self-exploration.
GeoGebra Commands & Parameters
CustomQuadrilateral(E, F, G, H) → q1, f, g, h, iCustomQuadrilateral(H, G, I, J) → q2, j, k, l, mCustomQuadrilateral(J, I, K, L) → q3, n, p, q, rCustomQuadrilateral(L, K, M, N) → q4, s, t, a, bSegment(O, P) → cSegment(P, Q) → dSegment(Q, R) → e
AI Drawing Prompt Reference
Draw a geometric figure consisting of four quadrilaterals connected by line segments, with overlapping points creating a continuous shape. Below the quadrilaterals, draw three parallel line segments to represent division or grouping.
The prompt above was compiled from the original drawing commands and is for reference only.