
ILS Group Problem #2: Algebraic Visualization of Mean and Spread
Loading the math board and drawing, please wait…
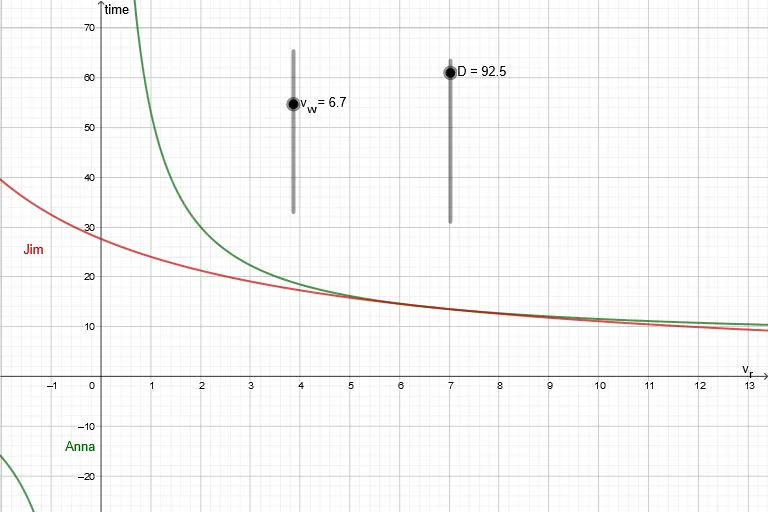
This GeoGebra example demonstrates how statistical measures tied to a dataset’s center (e.g., arithmetic mean) and its dispersion (e.g., standard deviation or an equivalent deviation-based quantity) can be modeled and visualized through algebraic relations. It highlights the bridge between numeric summaries and equation-based constraints: arithmetic operations, arithmetic mean, standard deviation, and linear equation structures used to express conditions or computed quantities. Exponential forms may appear in the computations (for weighting or deviation representations), and differential-calc concepts can be used to interpret how changes in inputs affect the modeled statistic. Construction is guided by the provided GeoGebra construction synopsis: it uses a vector/parameter object v_w, a computed/container object D, and named contributors Anna and Jim as data-related entities in the model. Overall, the figure is built by combining algebraic objects with statistical calculations so that “mean vs. spread” becomes an interactive, inspectable model. Suitable for high school through early undergraduate levels, especially for instruction or contest practice in integrating statistics with algebra via GeoGebra.
GeoGebra Commands & Parameters
Numeric v_{w}(6.7)Numeric D(92.5)Anna(x) = (D / 2 * (x + v_{w}) / ((v_{w} * x)))Jim(x) = ((2 * D)) / (v_{w} + x)
AI Drawing Prompt Reference
Create a statistical graph to visualize the central tendency (arithmetic mean) and dispersion (standard deviation) of a dataset. First, set a vector v_w to 6.7, then set a container D to 92.5. Next, calculate the functions for Anna and Jim based on v_w and D. Anna's function is D divided by 2 times (x + v_w) divided by (v_w times x), and Jim's function is 2 times D divided by (v_w + x). Finally, represent these function relationships graphically to form an interactive statistical model that allows you to observe the relationship between mean and spread.
The prompt above was compiled from the original drawing commands and is for reference only.