
Ice Cream Problem Simulation by Abdul Latiff
Loading the math board and drawing, please wait…
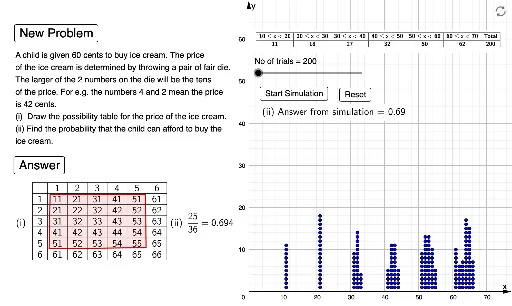
This example demonstrates probability distributions and statistical graphing through a simulated ice cream sales scenario. Core math concepts include probability & statistics, data distributions, trigonometric functions, and function graphing. GeoGebra commands used are Random, Length, CountIf, DotPlot, TableText, If, Sequence, and Polygon. Suitable for high school mathematics education to understand probability statistics and data processing methods.
GeoGebra Commands & Parameters
Random(1, 6) → d1Random(1, 6) → d2Length(data) → dCountIf(10 < x < 20, data) → e1DotPlot(data) → l1TableText(m1, "c|_") → text5CountIf(20 < x < 30, data) → e2CountIf(30 < x < 40, data) → e3CountIf(40 < x < 50, data) → e4CountIf(50 < x < 60, data) → e5CountIf(60 < x < 70, data) → e6TableText(l2, l3, "c|_") → text6If(c ≟ 20, b1, If[c ≟ 30, b2, If[c ≟ 40, b3, If[c ≟ 50, b4, b5]]]) → b6Sequence(i^(2) / 36, i, 1, 5) → l4If(c ≟ 20, Element[l4, 1], If[c ≟ 30, Element[l4, 2], If[c ≟ 40, Element[l4, 3], If[c ≟ 50, Element[l4, 4], Element[l4, 5]]]]) → b7Polygon(A, B, C, D) → q1, a, b, c_1, d_1Polygon(E, F, G, H) → q2, e_1, f, g, hPolygon(I, J, K, L) → q3, i, j, k_1, lPolygon(M, N, O, P) → q4, m_1, n_1, o_1, pPolygon(Q, R, S, T) → q5, q, r, s, tIf(c ≟ 20, Element[l4, 1], If[c ≟ 30, Element[l4, 2], If[c ≟ 40, Element[l4, 3], If[c ≟ 50, Element[l4, 4], Element[l4, 5]]]]) → uIf(c ≟ 20, q1, If[c ≟ 30, q2, If[c ≟ 40, q3, If[c ≟ 50, q4, q5]]]) → q6
AI Drawing Prompt Reference
Create an ice cream sales simulation graph with two dice d1 and d2 showing random results. The length d represents the sum of the two dice. Use a dot plot l1 to display the distribution of the sum of the dice. Count and display the number of points in the intervals 20-70 using if statements. Generate five equal-sized squares q1 to q5, with each square's area proportional to the number of points in the respective interval. Finally, use if statements to select and draw the appropriate square.
The prompt above was compiled from the original drawing commands and is for reference only.