
Hypothesis Testing I
Loading the math board and drawing, please wait…
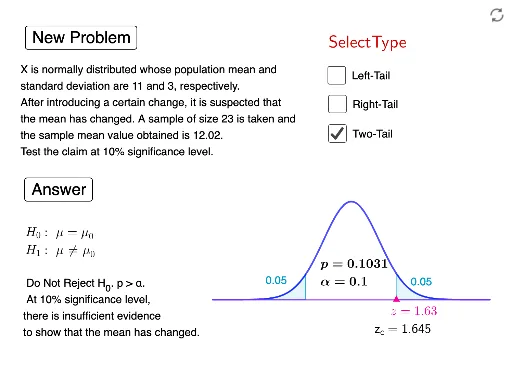
This example demonstrates the basic concepts of hypothesis testing. It involves probability and statistics knowledge such as normal distribution, random variables, and confidence intervals. Using GeoGebra commands like InverseNormal, Random, and Normal, users can intuitively understand the process of hypothesis testing. Suitable for high school mathematics education and learning.
GeoGebra Commands & Parameters
InverseNormal(0, 1, 1 - α1 / 2) → z32InverseNormal(0, 1, α1 / 2) → z31InverseNormal(0, 1, 1 - α1) → z2InverseNormal(0, 1, α1) → z1Random(20, 30) → nNormal(m, s / sqrt(n), z1, true) → cNormal(0, 1, x, false) → fIf(a ≟ 1, x11, If[a ≟ 2, x21, If[a ≟ 3, x31, If[a ≟ 4, x41, If[a ≟ 5, x51, If[a ≟ 6, x61, If[a ≟ 7, x71, x81]]]]]]) → x91If(a ≟ 1 ∨ a ≟ 2, "decreased", If[a ≟ 3 ∨ a ≟ 4, "increased", "changed"]) → text2If(a ≟ 1 ∨ a ≟ 2, text4, If[a ≟ 3 ∨ a ≟ 4, text5, text6]) → text7If(a ≟ 2 ∨ a ≟ 3 ∨ a ≟ 6 ∨ a ≟ 7, text9, text10) → text15If(a ≟ 2 ∨ a ≟ 3, text11, If[a ≟ 1 ∨ a ≟ 4, text12, If[a ≟ 6 ∨ a ≟ 7, text13, text14]]) → text16Normal(0, 1, x1, true) → p1Normal(0, 1, x2, true) → p2Integral(f, z2, 5) → b2Integral(f, -5, z31) → b31Integral(f, z32, 5) → b32If(a ≟ 1 ∨ a ≟ 2, z1, If[a ≟ 3 ∨ a ≟ 4, z2, If[a ≟ 5 ∨ a ≟ 6, z31, z32]]) → z9Integral(f, -5, z1) → b1
AI Drawing Prompt Reference
Draw a normal distribution curve with x-axis ranging from -5 to 5. Set a random sample size n between 20 and 30. Calculate the critical values z1 and z2 for the rejection regions and z31 and z32 for the acceptance regions based on the significance level α1. Plot the normal distribution curves c and f for the null and alternative hypotheses respectively. Display the test conclusion based on the hypothesis type.
The prompt above was compiled from the original drawing commands and is for reference only.