
Hypothesis Testing Example: Page 105, Example 4
Loading the math board and drawing, please wait…
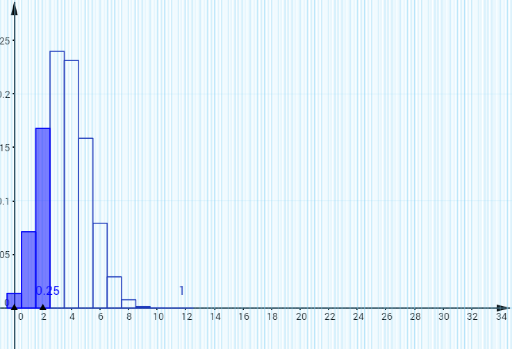
This example demonstrates the statistical process and visualization of hypothesis testing. Core math concepts include hypothesis testing principles, standard deviation calculation, and data sequence manipulation. GeoGebra commands and objects used in construction are RotateText, Sequence, Point, BarChart, Take, Min, Max, and objects like text3, text4, list1, etc. Suitable for high school and above students to understand statistical inference methods and tool applications.
GeoGebra Commands & Parameters
RotateText("y", 0) → text3RotateText("x", 0) → text4Sequence(Segment[(-100, i), (100, i)], i, -50, 50, 0.1) → list1Sequence(Segment[(-100, i), (100, i)], i, -50, 50, 0.5) → list2Sequence(Segment[(i, -100), (i, 100)], i, -50, 50, 0.1) → list3Sequence(Segment[(i, -100), (i, 100)], i, -50, 50, 0.5) → list4Point(xAxis) → APoint(xAxis) → BBarChart({0, 1, 2, 3, 4, 5, 6, 7, 8, 9, 10, 11, 12}, {0.013841287201, 0.071183762748, 0.167790297906, 0.23970042558, 0.231139696095, 0.158495791608, 0.079247895804, 0.029111471928, 0.00779771569500003, 0.00148527918, 0.000190964466000001, 0.0000148803480000001, 5.31440999999999E-7}, 1) → aTake({0.013841287201, 0.071183762748, 0.167790297906, 0.23970042558, 0.231139696095, 0.158495791608, 0.079247895804, 0.029111471928, 0.00779771569500003, 0.00148527918, 0.000190964466000001, 0.0000148803480000001, 5.31440999999999E-7}, x(A) + 1.5, x(B) + 1.5) → list5Take({0, 1, 2, 3, 4, 5, 6, 7, 8, 9, 10, 11, 12}, x(A) + 1.5, x(B) + 1.5) → list6BarChart(list6, list5, 1) → bSequence(12, 12, 0, 12) →Min(x(Point[xAxis]) + 1.5, x(Point[xAxis]) + 1.5) →Max(x(Point[xAxis]) + 1.5, x(Point[xAxis]) + 1.5) →