
Hypergeometric Probability Distribution Interactive Demo
Loading the math board and drawing, please wait…
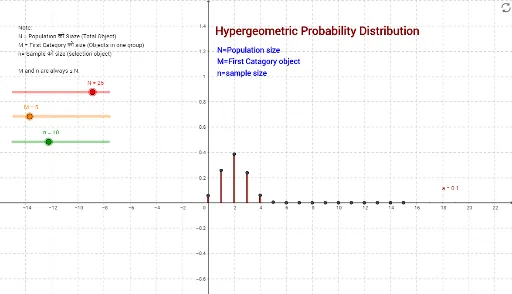
This GeoGebra example dynamically illustrates the hypergeometric probability distribution, showing how the probability of a certain number of successes changes when sampling without replacement from a finite population. The core mathematical concept is the hypergeometric distribution, involving combinations, probability mass functions, and summary statistics like expectation and variance. Construction highlights include using the HyperGeometric command to generate distribution data, Point and BarChart to plot the probability histogram, and sliders or parameters N, M, n to control population size, number of successes, and sample size. The Sum command computes cumulative probabilities, while multiple point objects (A1 to A11, etc.) mark individual probability values. Suitable for high school and university statistics courses, this tool helps students understand sampling without replacement and compare it with the binomial distribution, serving as an interactive visual aid in probability education.
GeoGebra Commands & Parameters
HyperGeometric(N, M, n, B1, false) → A1HyperGeometric(N, M, n, B2, false) → A2HyperGeometric(N, M, n, B3, false) → A3HyperGeometric(N, M, n, B4, false) → A4HyperGeometric(N, M, n, B5, false) → A5HyperGeometric(N, M, n, B6, false) → A6HyperGeometric(N, M, n, B7, false) → A7HyperGeometric(N, M, n, B8, false) → A8HyperGeometric(N, M, n, B9, false) → A9HyperGeometric(N, M, n, B10, false) → A10HyperGeometric(N, M, n, B11, false) → A11Point(yAxis) → BHyperGeometric(N, M, n, B12, false) → A12HyperGeometric(N, M, n, B15, false) → A15HyperGeometric(N, M, n, B14, false) → A14HyperGeometric(N, M, n, B13, false) → A13HyperGeometric(N, M, n, B16, false) → A16HyperGeometric(N, M, n, B17, false) → A17HyperGeometric(N, M, n, B18, false) → A18HyperGeometric(N, M, n, B19, false) → A19HyperGeometric(N, M, n, B20, false) → A20HyperGeometric(N, M, n, B21, false) → A21Sum(list1) → A23BarChart(list2, list1, 0.1) → a
AI Drawing Prompt Reference
Create a dynamic illustration of the hypergeometric probability distribution featuring three sliders for population size, number of successes, and sample size. Calculate and display a probability histogram based on slider values, mark individual probability values with points, and compute cumulative probabilities. The graph should dynamically show how the probability of a certain number of successes changes with different parameters in sampling without replacement.
The prompt above was compiled from the original drawing commands and is for reference only.