
Hypergeometric Distribution: Probability Calculation via Parameter Sweep
Loading the math board and drawing, please wait…
In collections
学习 GeoGebra 经典应用
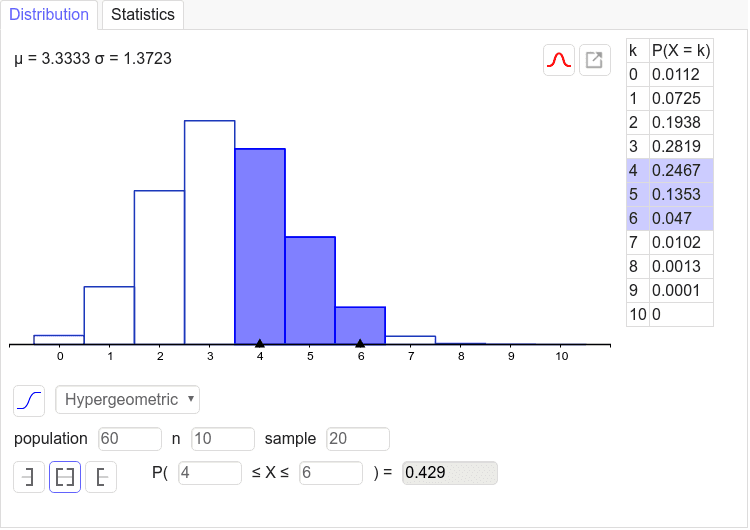
This example demonstrates how to visualize and compute probabilities for a hypergeometric distribution under sampling without replacement. It highlights the probability model in terms of the finite population parameters (N, K, n, k), and uses the distribution’s shape behavior (including typical symmetry/mean-related characteristics) to help learners interpret results. In GeoGebra construction, the key idea is to generate the needed parameter grid or k values using Sequence, then automatically determine the relevant plotting bounds with Min and Max so the resulting probability representation (e.g., graph/table-like elements) covers the full meaningful range. Suitable for high school and early undergraduate probability & statistics courses, and for classroom demonstrations or self-study on using GeoGebra to connect formulas with dynamic computation.
GeoGebra Commands & Parameters
Sequence(10, 10, 0, 10) →Min(x(Point[xAxis]) + 1.5, x(Point[xAxis]) + 1.5) →Max(x(Point[xAxis]) + 1.5, x(Point[xAxis]) + 1.5) →
AI Drawing Prompt Reference
Create a visualization for hypergeometric distribution probability calculation, featuring a parameter sequence, automatically determined plotting bounds, and displaying the distribution curve to highlight finite population parameters (N, K, n, k) and shape characteristics like symmetry related to the mean, suitable for probability and statistics education.
The prompt above was compiled from the original drawing commands and is for reference only.