
Hyperbola - Graph & Equations with Asymptotes
Loading the math board and drawing, please wait…
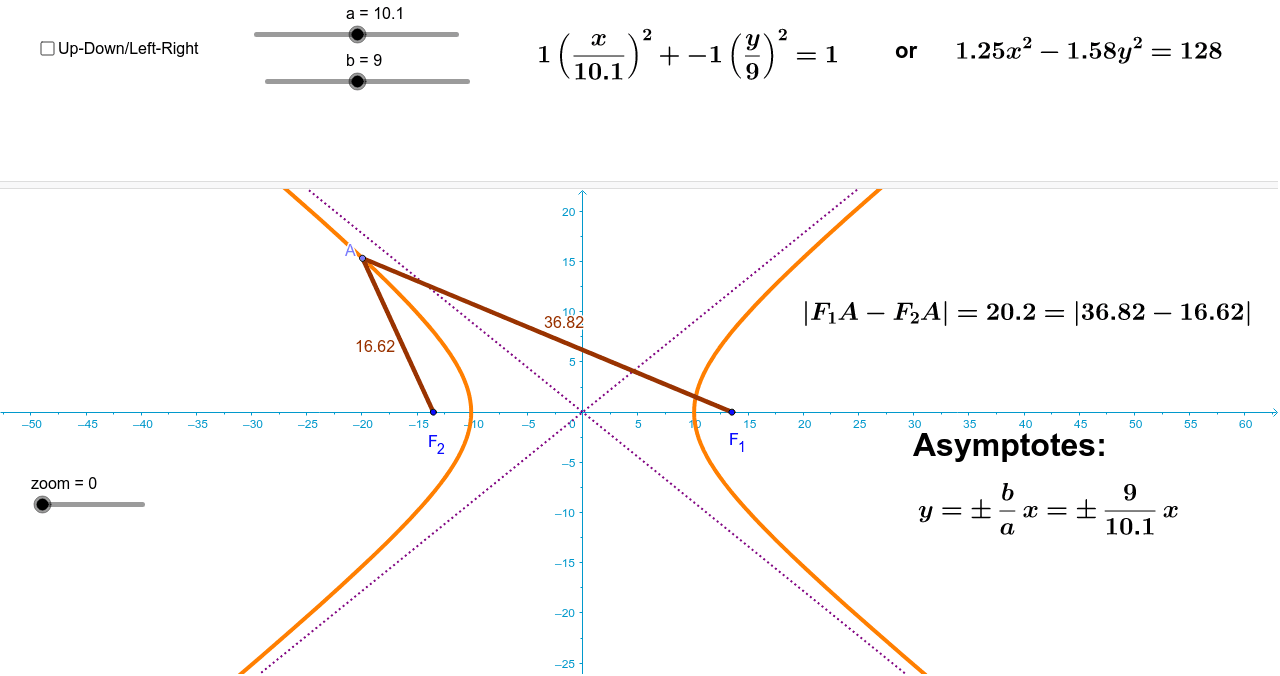
This example demonstrates the graph and equation of a hyperbola, along with its asymptotes, to understand the properties of hyperbolas. Key mathematical concepts include the definition of a hyperbola, its equation, and the geometric meaning of asymptotes. Using GeoGebra commands such as If, Point, and Segment, you can dynamically adjust the parameters of the hyperbola and observe its changes. Suitable for high school mathematics education, particularly for learning analytic geometry and function graphs.
GeoGebra Commands & Parameters
If(v ≟ 1, If[w ≟ 0, 1, -1], 1) → EllipseOrUpDownIf(v ≟ 0, If[a > b, ((-sqrt(a^(2) - b^(2))), 0), (0, (-sqrt(b^(2) - a^(2))))], If[w ≟ 0, ((-sqrt(a^(2) + b^(2))), 0), (0, (-sqrt(b^(2) + a^(2))))]) → F_2Point(c) → ASegment(A, F_2) → dIf(v ≟ 0, If[a > b, (sqrt(a^(2) - b^(2)), 0), (0, sqrt(b^(2) - a^(2)))], If[w ≟ 0, (sqrt(a^(2) + b^(2)), 0), (0, sqrt(b^(2) + a^(2)))]) → F_1Segment(A, F_1) → eIf(v ≟ 1, If[w ≟ 0, 1, -1], 1) → coef_xIf(v ≟ 1, If[w ≟ 1, 1, -1], 1) → coef_y
AI Drawing Prompt Reference
Draw a hyperbola with its asymptotes and two foci. The hyperbola's orientation can be horizontal or vertical based on parameters. Place a point on the curve and connect it to both foci with line segments to illustrate the constant difference of distances. Show the asymptotes to indicate the curve's opening direction. Include coordinate axes, the hyperbola, foci, asymptotes, and the connecting segments, all adjustable dynamically.
The prompt above was compiled from the original drawing commands and is for reference only.