
Hyperbola Asymptotes Demo
Loading the math board and drawing, please wait…
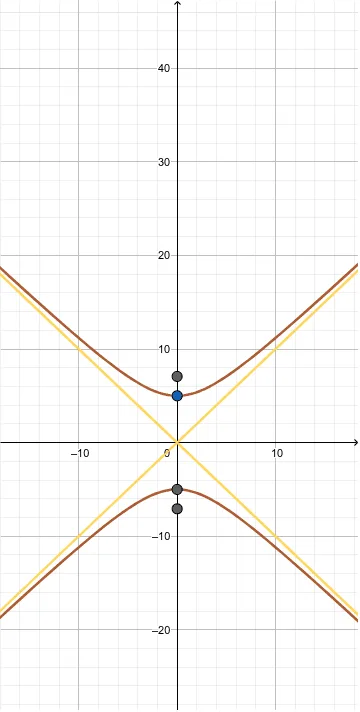
This example demonstrates the geometric relationship and variation patterns of a hyperbola and its asymptotes. It involves core mathematical concepts including the definition of a hyperbola, the properties of asymptotes, and the relationships among parameters a, b, c in analytical geometry. The construction uses GeoGebra commands/objects like b, a, c, f, g, A, B, C, D to build the hyperbola and its asymptotes. It is suitable for high school mathematics students and teachers to understand the geometric characteristics and parameter effects of hyperbolas, as well as for analytical geometry instruction.
GeoGebra Commands & Parameters
Numeric b(-5.0)Numeric a(-5.0)y^(2) / b^(2) - x^(2) / a^(2) = 1y = (b / a * x)y = ((-(b / a)) * x)(0, sqrt(a^(2) + b^(2)))(0, (-sqrt(a^(2) + b^(2))))(0, a)(0, (-a))
AI Drawing Prompt Reference
Draw a hyperbola and its asymptotes. The hyperbola is defined by parameters a and b. The asymptotes are two straight lines. The drawing should show the shape of the hyperbola and the position of the asymptotes. Make sure the graph is clear and label key points like the vertices.
The prompt above was compiled from the original drawing commands and is for reference only.