
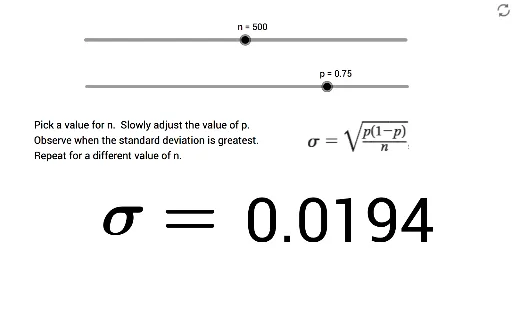
How Does P Value Affect the Maximum Sigma?
Loading the math board and drawing, please wait…
This example demonstrates the concept of standard deviation by adjusting the P value and observing the changes. It uses GeoGebra commands such as Text, p, n, A, B, pic1, text1, sig, text2, and text3 to dynamically show how standard deviation varies with P value. Suitable for high school math education, helping students understand the meaning and calculation of standard deviation.
GeoGebra Commands & Parameters
Text(sig) → text2