
Horizontal Translation by Debbie Barker
Loading the math board and drawing, please wait…
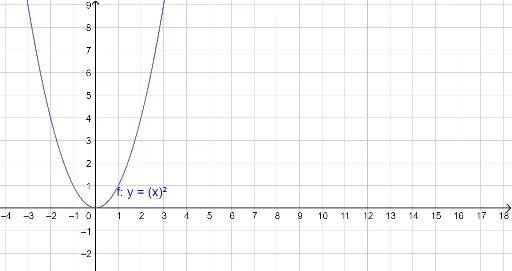
This example demonstrates horizontal translation to move a graph. Key mathematical concepts include translation and the movement of function graphs. By using GeoGebra commands to construct the translation, you can observe the movement of the graph along the x-axis. Suitable for high school mathematics education, particularly in coordinate geometry and function graph transformations.
GeoGebra Commands & Parameters
Numeric p(0)y = (x + p)^(2)y = x^(2)
AI Drawing Prompt Reference
Draw a Cartesian coordinate plane with two parabolas. The first parabola has its vertex at the origin, opening upward, representing y = x^2. The second parabola is a horizontal translation of the first, shifted to the left along the x-axis, with its vertex at a negative x-coordinate, representing y = (x + p)^2 where p is positive. Both parabolas have identical shape but different positions. Use distinct colors for each curve, and label the axes and key points to illustrate the horizontal shift of the function graph.
The prompt above was compiled from the original drawing commands and is for reference only.